Complaints this quarter
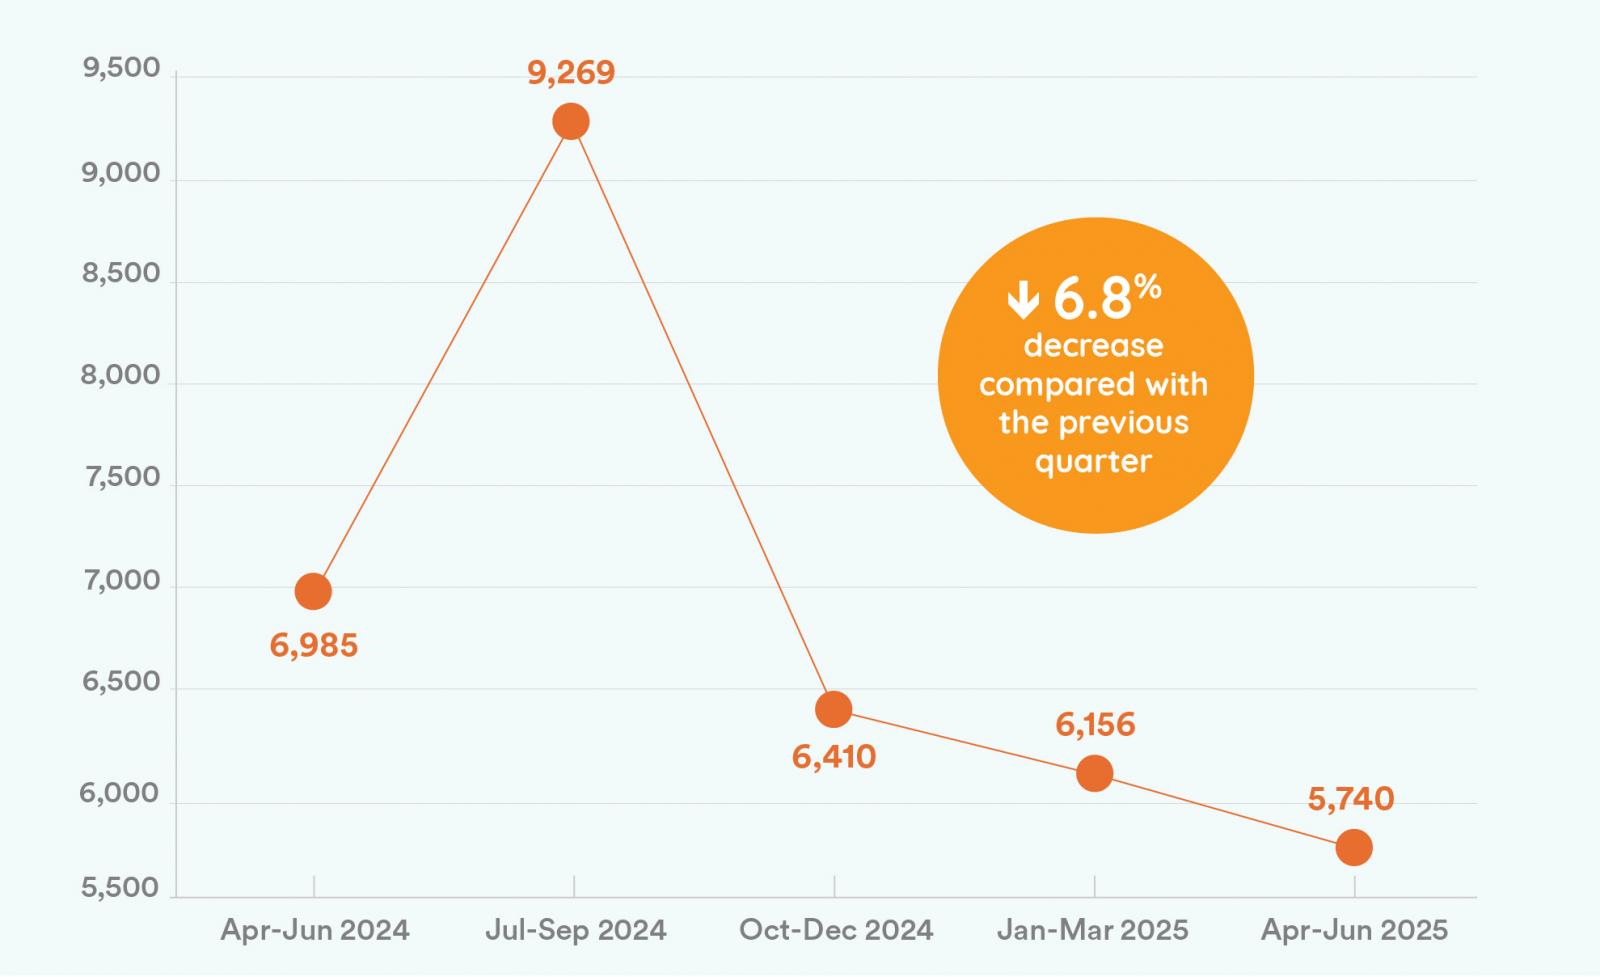
Complaints received in the April to June 2025 quarter reduced slightly by 6.8% compared to January to March 2025.
This continues a downward trend after a large increase in the July to September 2024 quarter due to cost of living pressures. Complaint numbers in April to June 2025 were 17.8% lower than April to June of 2024. We will continue to monitor the trend in complaints and whether we receive another large spike in complaints similar to July to September 2024. Complaints are generally higher after price rises that occur at the start of the financial year and after cooler months when customers receive larger winter bills.
We received 272 water complaints this quarter, a 3.9% decrease compared to the previous quarter, however an increase of 8.8% compared to the April to June 2024 period. We anticipate that water complaints will continue to increase following significant price increases on 1 July 2025 for Hunter Water and 1 October 2025 for Sydney Water.
Complaints received April - June 2024 to April - June 2025
Complaints by industry
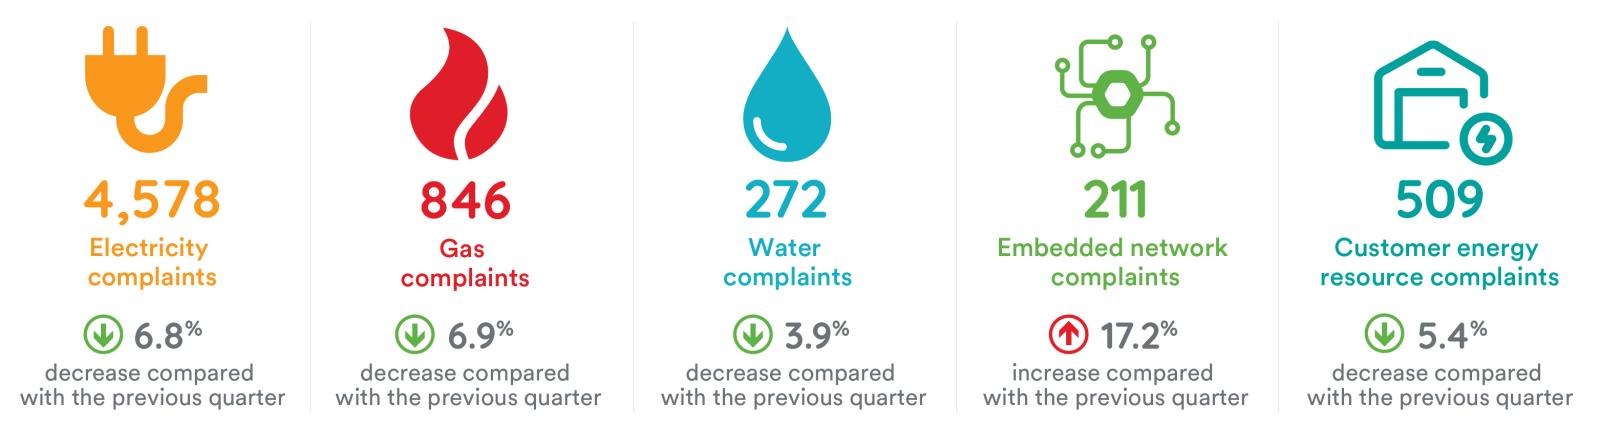
Complaints received by industry, April to June 2025
|
Case subject
|
Provider type
|
Apr – Jun 25
|
|
Electricity
|
Exempt retailer
|
42
|
|
Electricity
|
Network
|
332
|
|
Electricity
|
Retailer
|
4,135
|
|
Electricity
|
Not allocated
|
69
|
|
Electricity total
|
|
4,578
|
|
Gas
|
Network
|
38
|
|
Gas
|
Retailer
|
784
|
|
Gas
|
Not allocated
|
24
|
|
Gas total
|
|
846
|
|
Water
|
Network
|
151
|
|
Water
|
Retailer
|
69
|
|
Water
|
Not allocated
|
52
|
|
Water total
|
|
272
|
|
Non-energy/ non-water total
|
|
44
|
|
Grand total
|
5,740
|
Customer complaint issues
The issue most raised by customers in April to June 2025 was once again high bills. This is consistent with previous quarters, however, high bills have trended down as an overall percentage of core issues raised. Complaints from customers with difficulty paying a bill/debt have remained consistent.
Issues about rebates or concession errors has increased, showing that customers continuing to look for assistance with cost of living. There has also been a 20.8% increase in customers raising issues with closing their accounts, which may reflect greater movement of customers looking for a better energy deal with different retailers.
Top 10 core issues closed, April to June 2025, including the previous four quarters
|
Primary issue
|
Secondary issue > tertiary issues
|
Apr – Jun 25
|
Jan – Mar 25
|
Oct – Dec 24
|
Jul – Sep 24
|
Apr – Jun 24
|
|
Billing
|
High > disputed
|
1.592
27.20%
|
1,911
30.43%
|
2,349
35.80%
|
3,407
37.33%
|
2,440
34.40%
|
|
Billing
|
Estimation > meter access / not read |
214
3.66%
|
248
3.95%
|
250
3.81%
|
356
3.90%
|
269
3.79%
|
|
Billing
|
Error / payment
|
183
3.13%
|
217
3.46%
|
199
3.03%
|
250
2.74%
|
176
2.48%
|
|
Billing
|
Account closing > error |
174
2.97%
|
144
2.29%
|
162
2.47%
|
181
1.98%
|
151
2.13%
|
|
Billing
|
Refund or credit > delay / error / form
|
150
2.56%
|
158
2.52%
|
188
2.87%
|
200
2.19%
|
202
2.85%
|
|
Billing
|
Backbill
|
146
2.49%
|
119
1.90%
|
142
2.16%
|
199
2.18%
|
174
2.45%
|
|
General
|
Energy / water
|
146
2.49%
|
130
2.07%
|
159
2.42%
|
228
2.50%
|
209
2.95%
|
|
Billing
|
Information*
|
145
2.48%
|
149
2.37%
|
159
2.42%
|
254
2.78%
|
192
2.71%
|
|
Billing
|
Rebate / concession > error
|
139
2.38%
|
124
1.97%
|
168
2.56%
|
288
3.16%
|
257
3.62%
|
|
Credit
|
Payment difficulties > current / arrears
|
129
2.20%
|
126
2.01%
|
82
1.25%
|
139
1.52%
|
99
1.40%
|
* Billing > information is a renamed issue from Billing > other
Water complaints
Top five water core issues, April to June 2025
|
Complaint issues
|
Number
|
|
Billing > high > disputed
|
70
|
|
General > water
|
50
|
|
Supply > sewer overflow / blockage
|
18
|
|
Land > network / transmission assets > maintenance
|
12
|
|
Supply > quality
|
10
|
Embedded network complaints
This quarter EWON received 211 complaints from embedded network customers, an increase of 17.2% on the previous quarter. Embedded network complaints have been fluctuating for several quarters; we will closely monitor to see if there is spike in the July to September quarter, as occurred in FY 2024.
Embedded network complaints by service provider, April to June 2025
|
Service provider
|
Complaints by embedded network customers
|
|
Electricity > network > exempt
|
12
|
|
Electricity > retail > authorised
|
142
|
|
Electricity > retail > exempt
|
42
|
|
Electricity > not allocated
|
1
|
|
Gas > retail > authorised
|
13
|
|
Water > retail > exempt
|
1
|
|
Total
|
211
|
Top five embedded network core issues closed, April to June 2025
|
Core complaint issues
|
Complaints
|
|
Billing > high > disputed
|
70
|
| Billing > fees & charges > service availability |
10
|
| Billing > rebate / concession > error |
10
|
|
Billing > tariff > rate
|
8
|
|
Billing > rebate / concession > information
|
7
|
Consumer energy resources complaints
Consumer energy resources (CER) refers to consumer-owned resources like rooftop solar, batteries, and electric vehicle chargers that can generate or store electricity. This quarter, there were 509 complaints from customers using CER, a slight reduction of 5.4% compared to the previous quarter. Complaints from customers using CER made up 11.0% of EWON’s overall complaints about electricity for the quarter. Even though this is a slight reduction, it remains largely consistent with the 12.87% of overall electricity complaints in the same period of 2024.
Complaints received involving behind the meter products by service provider, April to June 2025
|
Service provider
|
Complaints opened involving behind the meter products
|
|
Electricity > network > authorised
|
15
|
|
Electricity > network > exempt
|
1
|
|
Electricity > not allocated
|
51
|
|
Electricity > retail > authorised
|
435
|
|
Electricity > retail > exempt
|
7
|
|
Total
|
509
|
Top five core issues for closed complaints involving consumer energy resources, April to June 2025
|
Core complaint issues
|
Total
|
|
Billing > high > disputed
|
171
|
|
Billing > tariff > feed-in
|
49
|
| Digital meter exchange > fault > solar connection |
30
|
| Consumer Energy Resource > system performance > fault |
18
|
| Digital meter exchange > delay |
17
|
Renewable energy infrastructure complaints
Complaints received Dec 2024 – Jun 2025
| Level |
Complaints |
| General enquiry |
1 |
| Complaint enquiries |
33 |
| Refer to Higher Level |
1 |
| Investigations |
5 |
| TOTAL |
40 |
Complaints breakdown by area or project, Dec 2024 – Jun 2025
| Area or project |
Complaints |
| Central West Orana |
26 |
| New England |
2 |
| South West |
1 |
| Hunter Central Coast |
2 |
| Hunter Transmission Project |
2 |
| Humelink |
4 |
| Other |
3 |
Complaints by type, Dec 2024 – Jun 2025
| Type |
Complaints |
| Transmission |
12 |
| REZ development & planning |
19 |
| Generation* |
9 |
* These complaints are out of jurisdiction, we generally refer them to the Australian Energy Infrastructure Commissioner
Complaint issue for renewable energy infrastructure complaints, Dec 2024 – Jun 2025
|
Complaint issues
|
Total
|
|
Land> network / transmission assets > placement
|
19
|
|
General > energy (referrals – out of jurisdiction)
|
9
|
|
Land > easement
|
4
|
|
Land > network / transmission assets > health / safety
|
2
|
|
Customer service > failure to consult / inform
|
2
|
|
Customer service > failure to respond
|
1
|
|
Customer service > incorrect advice / information
|
1
|
|
Customer service > phone > call drop out
|
1
|
|
Privacy > other
|
1
|
|
Total
|
40
|