-
Home
-
Publications and submissions
-
Reports
-
EWON Insights
-
EWON Insights Jan-Mar 2021
- Complaint activity
Complaint activity
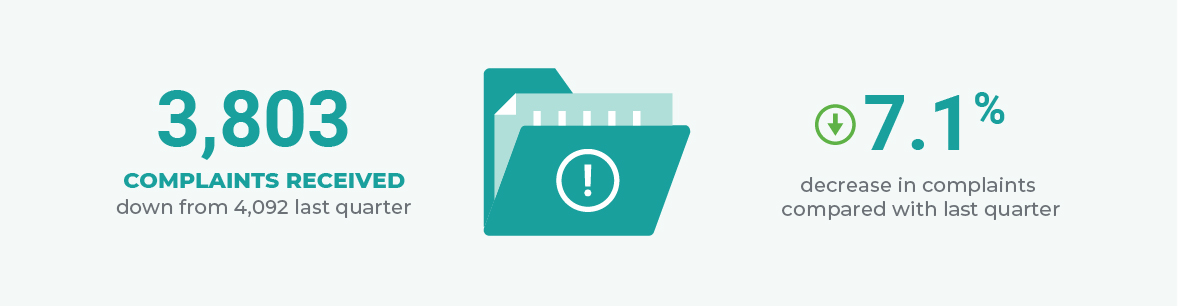
Complaints received this quarter decreased by 7.1% to 3,803 (down from 4,092), due to decreased complaints from electricity and gas customers. The single biggest fall in complaint issues was a significant drop in disputed high bill complaints. The restrictions on various credit activities associated with the Australian Energy Regulator’s (AER) Statement of Expectations which is in place until 30 June 2021 underpins the decline in complaints.
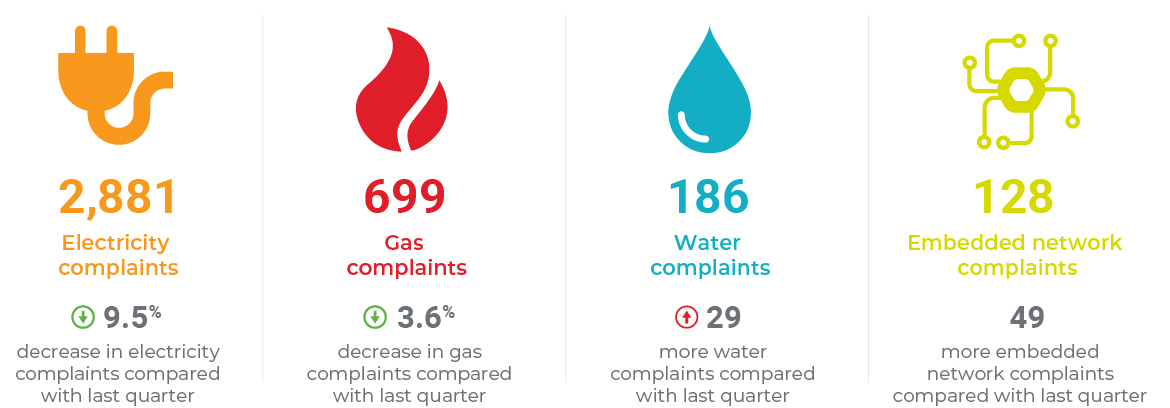
Electricity: Total electricity complaints were 2,881 falling 9.5% compared to the previous quarter’s 3,184. The 2,626 electricity retail complaints we received represents an 8.7% decrease on last quarter’s 2,875 complaints. Network complaints fell by 23.2%, with 205 complaints compared to 267 in the previous quarter.
Gas: At 699, overall gas complaints were 3.6% lower compared to 725 complaints received in the previous quarter. The number of gas retail complaints received during the quarter (647) decreased by 4.9% compared with the previous quarter (680). The number of gas network complaints (43) increased by 13 from the last quarter.
Water: We received 186 water complaints this quarter, 29 more than last quarter.
The graph below shows complaints received in Jan-Mar 2021 compared with the previous quarter.
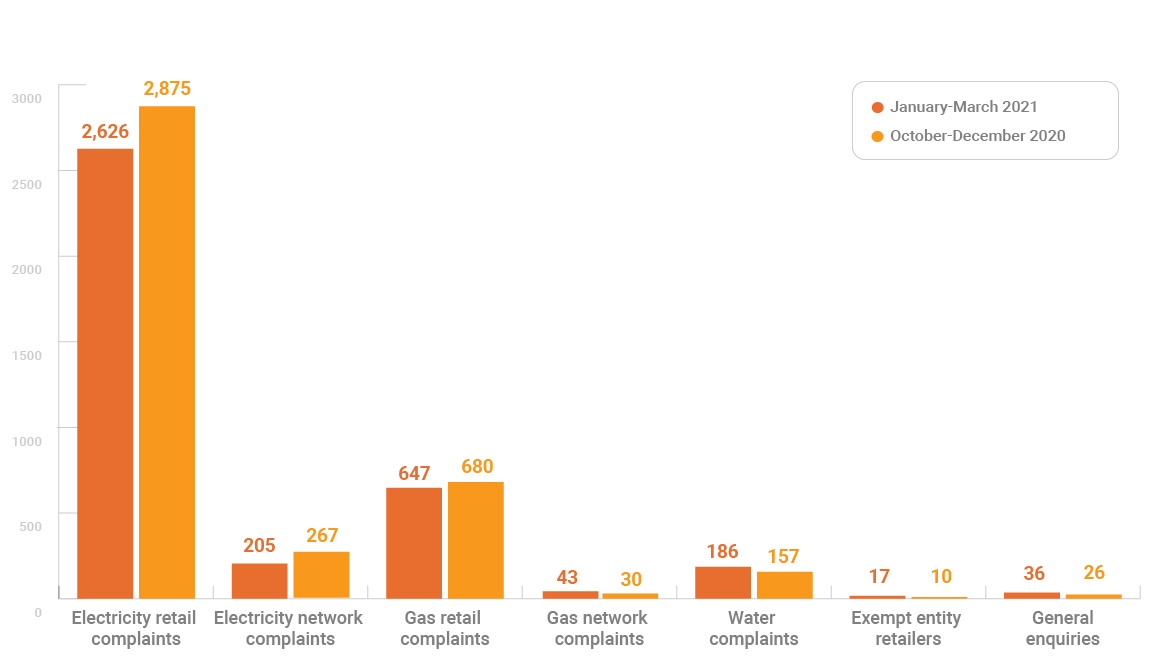
Table 1 provides detailed information about the number of complaints received from January to March 2021 compared to the previous four quarters.
Table 1 – Complaints opened January to March 2021, including the previous four quarters
| Case subject | Provider type | Jan-Mar 2021 | Oct-Dec 2020 | Jul-Sep 2020 | Apr-Jun 2020 | Jan-Mar 2020 |
|---|---|---|---|---|---|---|
| Electricity | Exempt retailer | 17 | 10 | 21 | 12 | 14 |
| Electricity | Network | 205 | 267 | 251 | 259 | 368 |
| Electricity | Retailer | 2,626 | 2,875 | 3,149 | 2,658 | 3,457 |
| Electricity | Not allocated | 33 | 32 | 33 | 63 | 101 |
| Electricity total | 2,881 | 3,184 | 3,454 | 2,992 | 3,940 | |
| Gas | Exempt retailer | 0 | 0 | 0 | 0 | 0 |
| Gas | Network | 43 | 30 | 50 | 21 | 31 |
| Gas | Retailer | 647 | 680 | 673 | 520 | 658 |
| Gas | Not allocated | 10 | 15 | 16 | 10 | 8 |
| Gas total | 699 | 725 | 739 | 551 | 697 | |
| Non-energy/ non-water | Not allocated | 36 | 26 | 24 | 15 | 22 |
| Non-energy/ non-water total | 36 | 26 | 24 | 15 | 22 | |
| Water | Network | 60 | 47 | 44 | 74 | 85 |
| Water | Retailer | 101 | 80 | 92 | 99 | 129 |
| Water | Not allocated | 25 | 30 | 20 | 18 | 24 |
| Water total | 186 | 157 | 156 | 191 | 238 | |
| Grand total | 3,803 | 4,092 | 4,373 | 3,749 | 4,897 |