-
Home
-
Publications and submissions
-
Reports
-
EWON Insights
-
EWON Insights Jan-Mar 2025
- Complaints Jan-Mar 2025
Complaints Jan-Mar 2025
Complaints this quarter
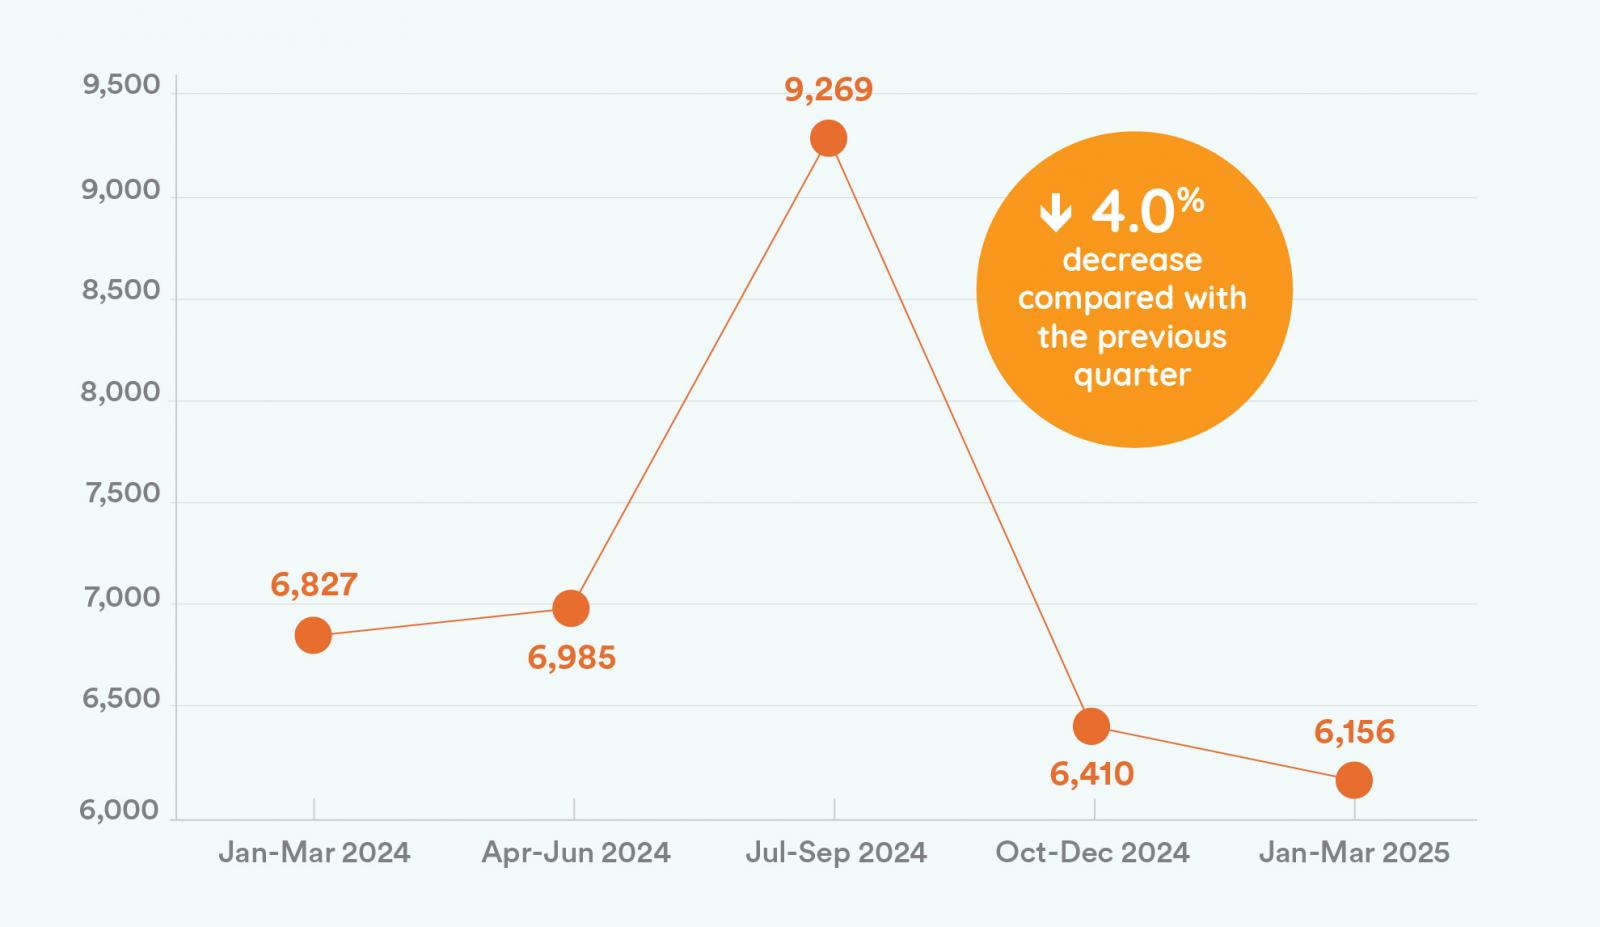
Complaints received in the January to March 2025 quarter reduced slightly by 4.0% compared to October to December 2024. This continues a downward trend we started to see in that quarter, when complaint numbers reduced after a sharp spike in the July to September 2024 quarter. Complaints numbers in January to March 2025 were 9.8% lower than January to March 2024. It remains to be seen if the downward trend continues, because there is often an increase in complaints as we start to enter the cooler months and see the impact of seasonal energy usage on people’s bills.
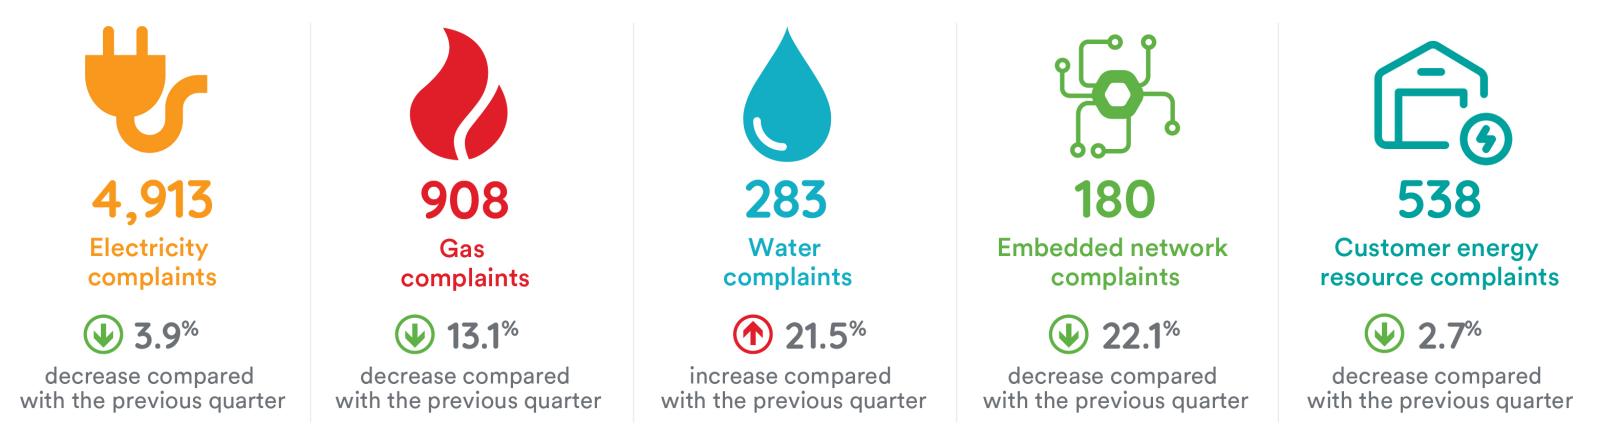
Despite a lowering of overall complaint numbers, complaints in the water sector rose. We received 283 water complaints this quarter, a 21.5% increase compared to the prior quarter and an increase of 22.5% from the January to March 2024 period. The October to December 2024 Insights report explored the water complaint issues and trends which could be driving the increase.
January-March 2024 to January-March 2025
Complaints by industry
Complaints received by industry, January to March 2025
|
Case subject |
Provider type |
Jan – Mar 25 |
|
|---|---|---|---|
|
Electricity |
Exempt retailer |
65 |
|
|
Electricity |
Network |
356 |
|
|
Electricity |
Retailer |
4,409 |
|
|
Electricity |
Not allocated |
83 |
|
|
Electricity total |
|
4,913 |
|
|
Gas |
Exempt retailer |
0 |
|
|
Gas |
Network |
27 |
|
|
Gas |
Retailer |
860 |
|
|
Gas |
Not allocated |
21 |
|
|
Gas total |
|
908 |
|
|
Water |
Network |
84 |
|
|
Water |
Retailer |
148 |
|
|
Water |
Not allocated |
51 |
|
|
Water total |
|
283 |
|
|
Non-energy/ Non-water total |
|
52 |
|
|
Grand total |
6,156 |
||
Customer complaint issues
The majority of the top 10 issues decreased this quarter compared to October to December 2024, following the overall downward trend for complaint numbers. However, the 53.7% increase in complaints about difficulty paying a bill/debt indicates that cost of living pressures continue to impact people and drive complaints.
Top 10 core issues closed, January to March 2025, including the previous four quarters
|
Primary issue |
Secondary issue > tertiary issues |
Jan – Mar 25 |
Oct – Dec 24 |
Jul – Sep 24 |
Apr – Jun 24 |
Jan – Mar 24 |
|---|---|---|---|---|---|---|
|
Billing |
High > disputed |
1,911 |
2,349 |
3,407 |
2,440 |
2,486 |
|
Billing |
Estimation > meter access / not read |
248 |
250 |
356 |
269 |
284 |
|
Billing |
Error / payment |
217 |
199 |
250 |
176 |
154 |
|
Billing |
Refund or credit > delay / error / form |
158 |
188 |
200 |
202 |
139 |
|
Billing |
Information |
149 |
159 |
254 |
192 |
275 |
|
Billing |
Account closing > error |
144 |
162 |
181 |
151 |
140 |
|
General |
Energy / water |
130 |
159 |
228 |
209 |
162 |
|
Credit |
Payment difficulties > current / arrears |
126 |
82 |
139 |
99 |
128 |
|
Billing |
Rebate / concession > error |
124 |
168 |
288 |
257 |
178 |
|
Billing |
Backbill |
119 |
142 |
199 |
174 |
158 |
*Billing > Information is a renamed issue from Billing > Other
Water complaints
Top five water core issues, January to March 2025
|
Complaint issues |
Number |
|---|---|
|
Billing > high > disputed |
61 |
|
General > water |
51 |
|
Land > property damage / restoration |
17 |
| Land > network / transmission assets > maintenance |
9 |
| Supply > sewer overflow / blockage |
9 |
Embedded network complaints
This quarter EWON opened 180 complaints from embedded network customers. Embedded network complaints spiked to 272 in the July to September 2024 quarter, then reduced to 231 in the October to December 2024 quarter. This quarter they decreased a further 22.1% and are now back down to a similar level as January to March 2024 (179 complaints).
Embedded network complaints by service provider, January to March 2025
|
Service provider |
Complaints by embedded network customers |
|---|---|
|
Electricity > network > exempt |
5 |
|
Electricity > retail > authorised |
104 |
|
Electricity > retail > exempt |
62 |
|
Electricity > not allocated |
1 |
|
Gas > retail > authorised |
8 |
|
Total |
180 |
Top five embedded network core issues closed, January to March 2025
|
Core complaint issues |
Complaints |
|---|---|
|
Billing > high > disputed |
43 |
| Billing > fees and charges > service availability |
10 |
| Billing > rebate / concession > error |
10 |
| Billing > rebate / concession > information |
9 |
|
Billing > delay |
7 |
Consumer energy resources complaints
This quarter 538 complaints came from customers using consumer energy resources (CER), a slight reduction of 2.7% compared to the previous quarter. Complaints from customers using CER made up 11.0% of EWON’s overall complaints about electricity for the quarter.
Complaints received involving behind the meter products by service provider, January to March 2025
|
Service provider |
Complaints opened involving behind the meter products |
|---|---|
|
Electricity > network > authorised |
18 |
| Electricity > network > exempt | 2 |
|
Electricity > not allocated |
60 |
|
Electricity > retail > authorised |
447 |
|
Electricity > retail > exempt |
11 |
|
Total |
583 |
Top five core issues for closed complaints involving consumer energy resources, January to March 2025
|
Core complaint issues |
Total |
|---|---|
|
Billing > high > disputed |
198 |
|
Billing > tariff > feed-in |
44 |
|
Consumer energy resource > system performance > fault |
29 |
|
Digital meter exchange > fault > solar connection |
22 |
| Digital meter exchange > delay |
16 |