-
Home
-
Publications and submissions
-
Reports
-
EWON Insights
-
EWON Insights Jul-Sep 2021
- Complaint activity
Complaint activity
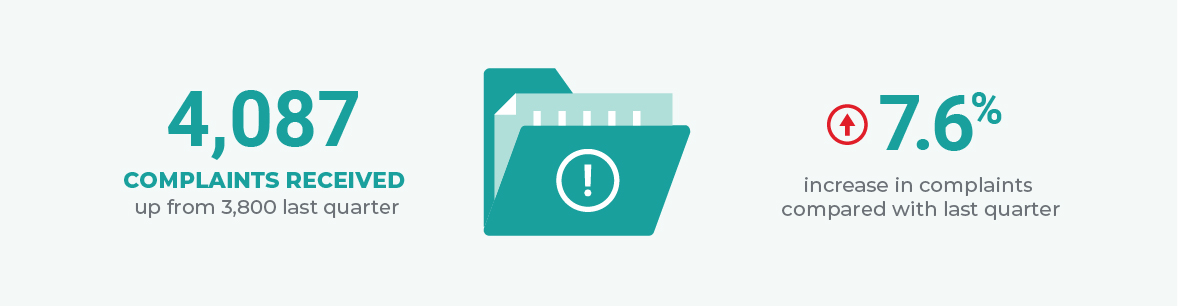
Complaints received this quarter increased to 4,087, compared to 3,800 in the last quarter.
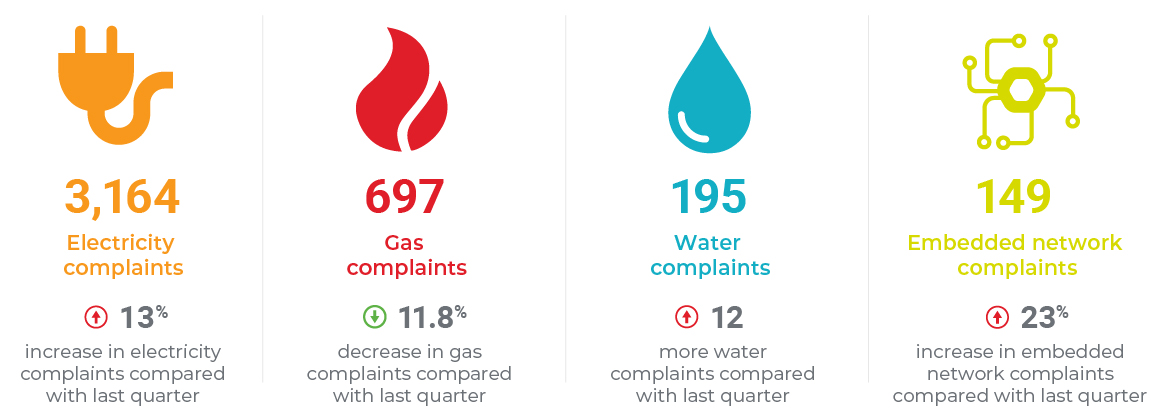
Electricity: Total electricity complaints were 3,164 increasing 13.2% compared to the previous quarter’s 2,796. The 2,853 electricity retail complaints we received during the period represent a 12.5% increase on last quarter’s 2,536 complaints. Network complaints increased by 31.1%, with 253 complaints compared to 193 in the previous quarter.
Gas: At 697, overall gas complaints were 11.8% lower compared to 790 complaints received in the previous quarter. The number of gas retail complaints received during the quarter (657) decreased by 7.3% compared with the previous quarter (709). The number of gas network complaints (23) decreased by 36 from the last quarter.
Water: We received 195 water complaints this quarter, 12 more than last quarter.
Graph - complaints opened Jul-Sep 2021 compared to previous quarter
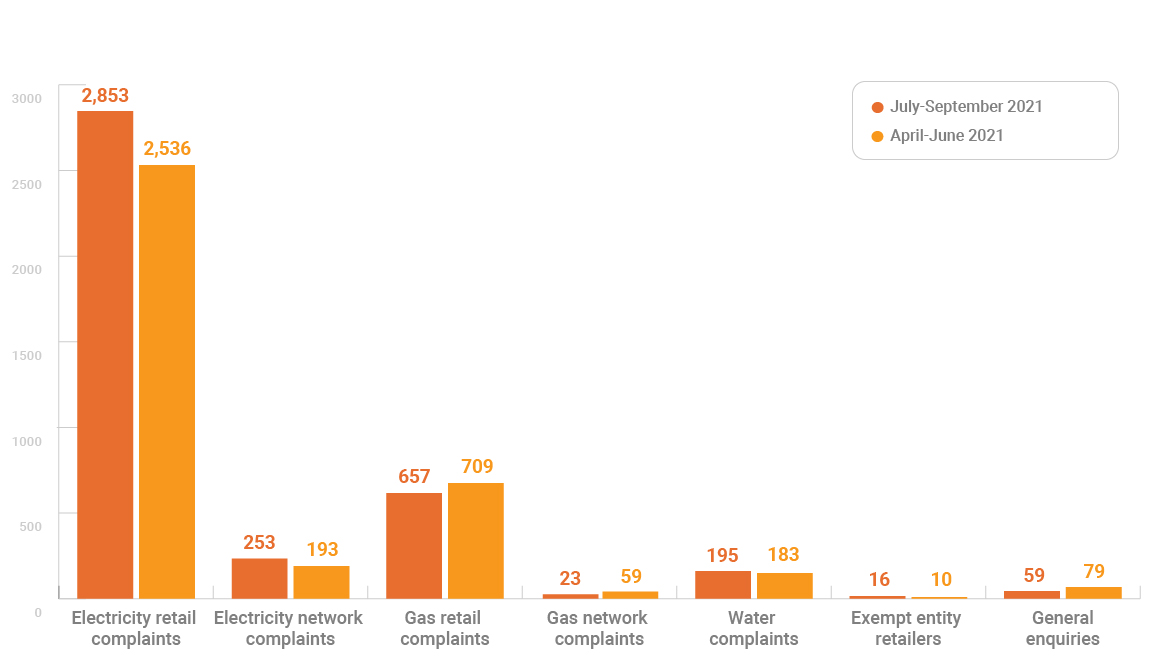
Table 1 provides detailed information about the number of complaints received from July to September 2021 compared to the previous four quarters.
Table 1 – Complaints opened July to September 2021, including the previous four quarters
| Case subject | Provider type | Jul-Sep 2021 | Apr-Jun 2021 | Jan-Mar 2021 | Oct-Dec 2020 | Jul-Sep 2020 |
|---|---|---|---|---|---|---|
| Electricity | Exempt retailer | 16 | 9 | 17 | 10 | 21 |
| Electricity | Network | 253 | 193 | 205 | 267 | 251 |
| Electricity | Retailer | 2,853 | 2,536 | 2,626 | 2,875 | 3,149 |
| Electricity | Not allocated | 42 | 58 | 33 | 32 | 33 |
| Electricity total | 3,164 | 2,796 | 2,881 | 3,184 | 3,454 | |
| Gas | Exempt retailer | 0 | 1 | 0 | 0 | 0 |
| Gas | Network | 23 | 59 | 43 | 30 | 50 |
| Gas | Retailer | 657 | 709 | 647 | 680 | 673 |
| Gas | Not allocated | 17 | 21 | 10 | 15 | 16 |
| Gas total | 697 | 790 | 699 | 725 | 739 | |
| Non-energy/ non-water | Not allocated | 31 | 31 | 36 | 26 | 24 |
| Non-energy/ non-water total | 31 | 31 | 36 | 26 | 24 | |
| Water | Network | 49 | 56 | 60 | 47 | 44 |
| Water | Retailer | 109 | 103 | 101 | 80 | 92 |
| Water | Not allocated | 37 | 24 | 25 | 30 | 20 |
| Water total | 195 | 183 | 186 | 157 | 156 | |
| Grand total | 4,087 | 3,800 | 3,802 | 4,092 | 4,373 |