-
Home
-
Publications and submissions
-
Reports
-
EWON Insights
-
EWON Insights Jul-Sep 2023
- Customer activity
Customer activity
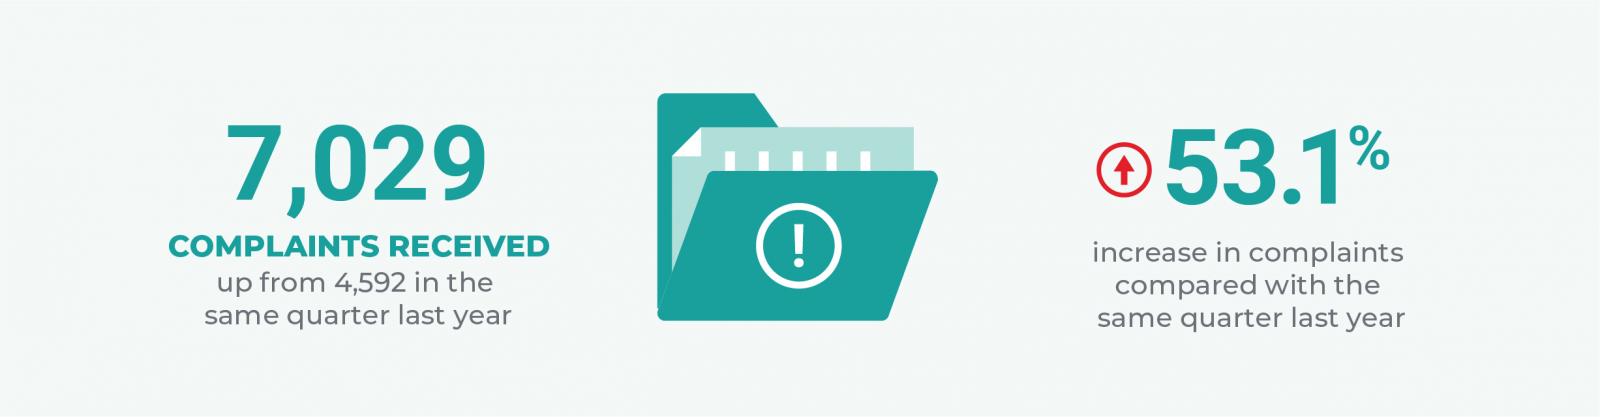
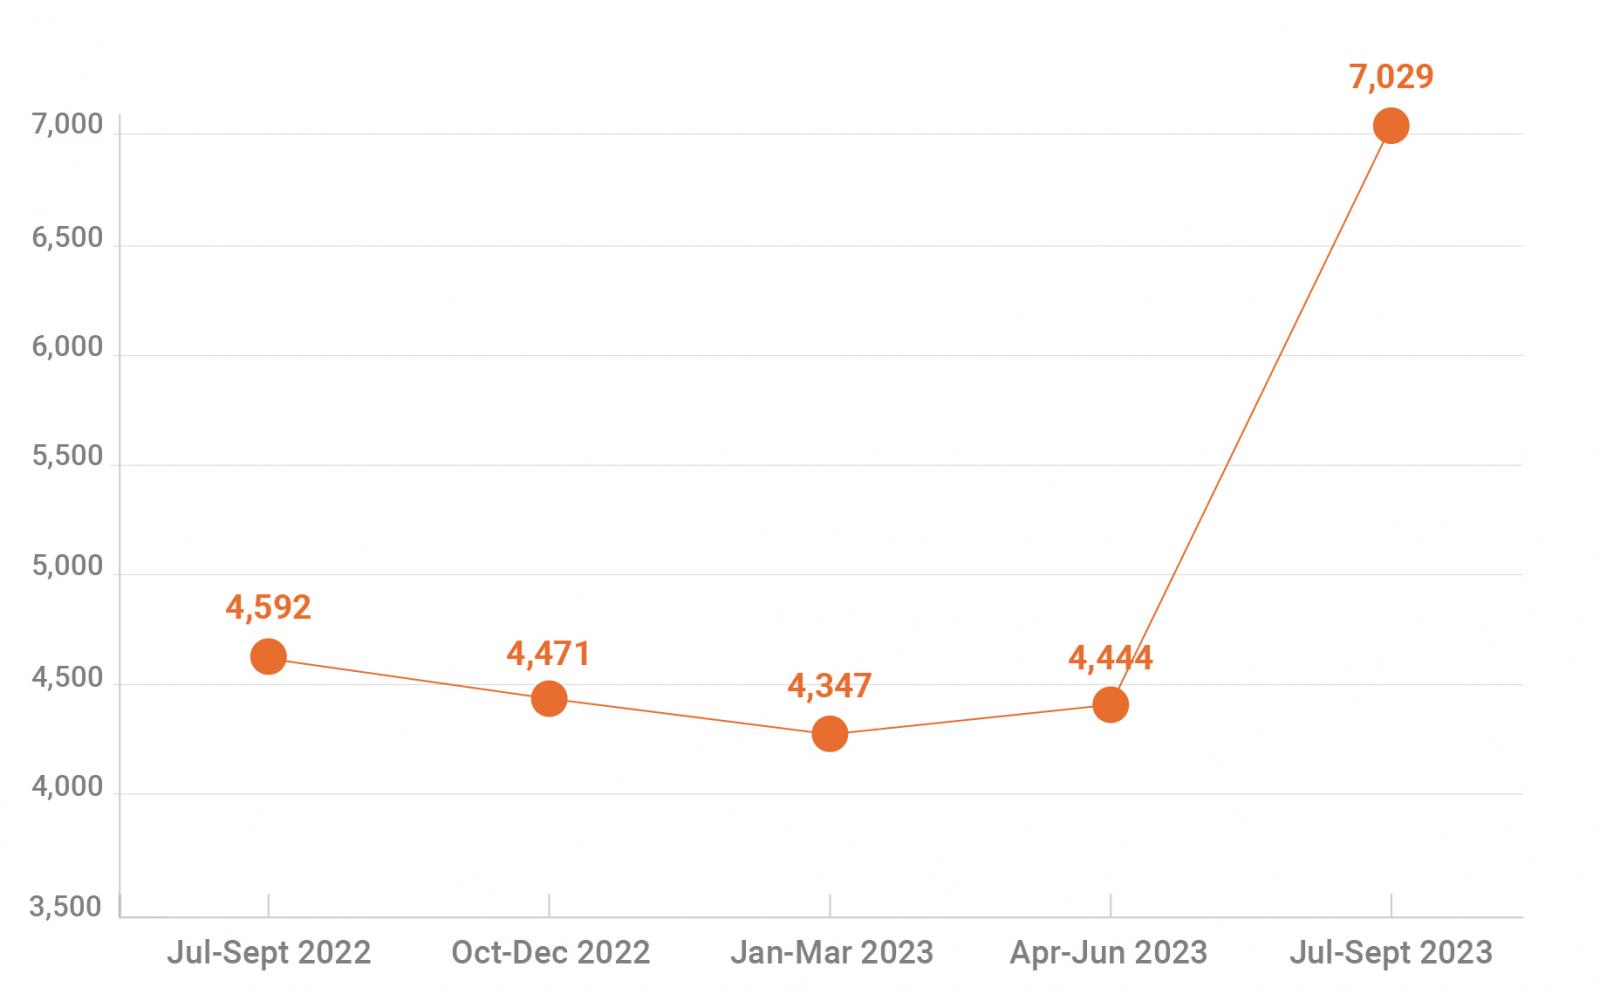
In July to September 2023, we received 7,029 complaints. This is a significant increase of 58.2% compared to the quarter before, and 53.1% higher than the July to September 2022 quarter.
Complaints received over five quarters
July-September 2022 to July-September 2023
Like previous quarters it is evident that increased energy prices and cost of living stress remain major complaint drivers. Customers are starting to receive their winter bills and the higher winter usage is compounded with the significant price increases from 1 July 2023. High bills were the largest driver for complaints reported to EWON, however price increases and payment difficulties were also present in the top 10 complaint issues. This indicates that, while customers may understand higher bills are due to price increases, they are also concerned about the impact this is having on their ability to pay.
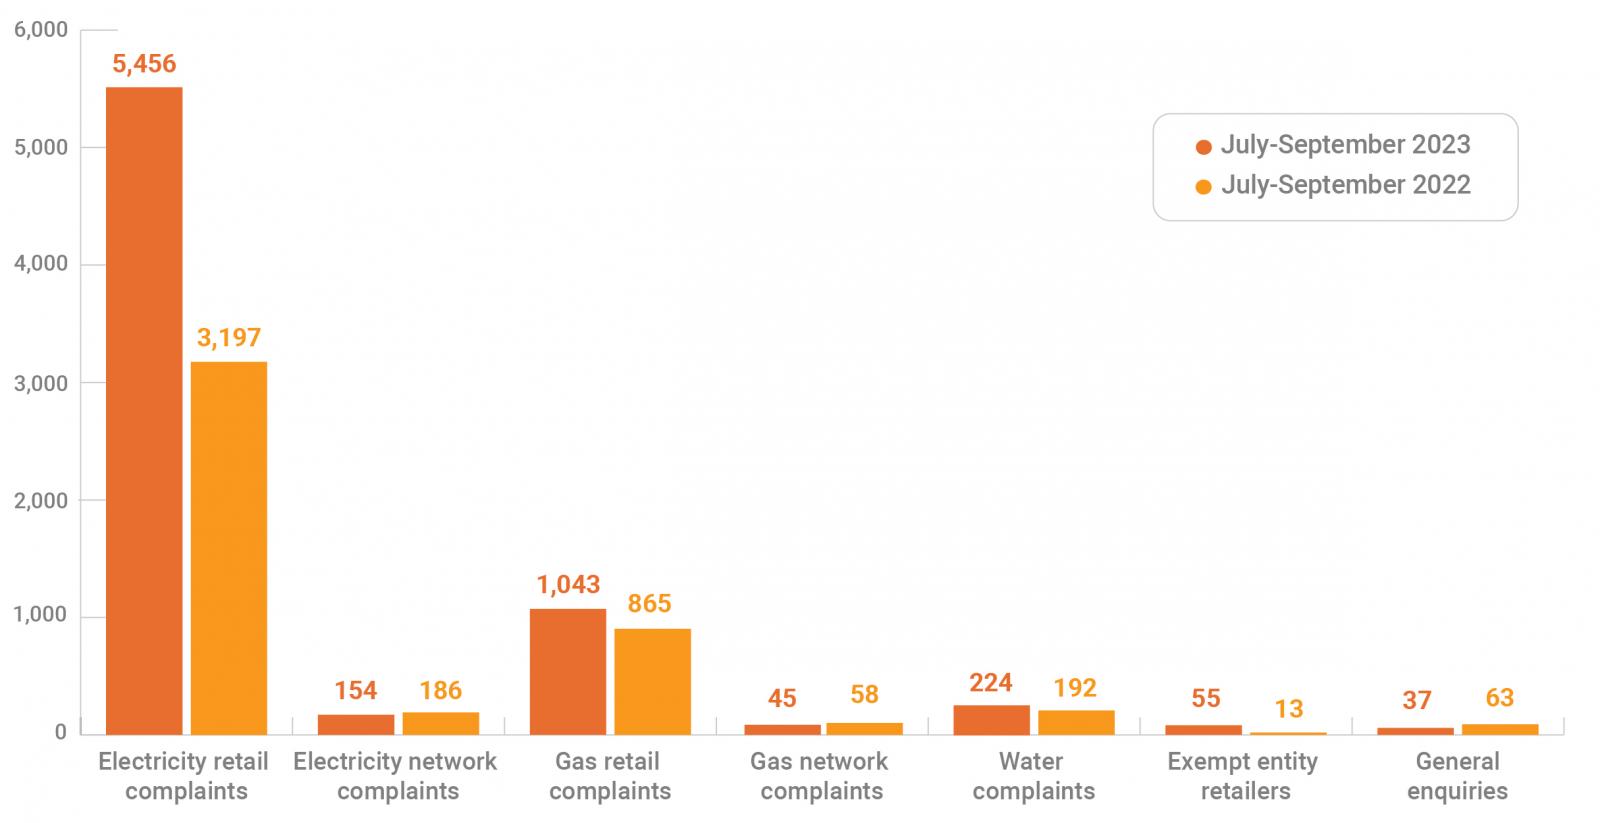
Table 1 and 2 - Top 10 core issues and top 10 issues, including the previous four quarters.
Price increase complaints were 48.7% higher than the quarter before, and 21.9% higher than in July to September 2022, however this can be attributed to annual price increases each year. Payment difficulty complaints trended up compared to the quarter before, increasing by 26.5%, and the same quarter the year before, increasing by 31.1%.
Customers are starting to receive the National Energy Bill Relief payments. Our complaint data indicates that customers are more closely scrutinising their bills and their eligibility for other assistance. Complaints where customers raised issues with rebate and concession errors increased by 138.7% compared to the previous quarter.
The trend of increased complaints has now been ongoing for over 12 months, however it is unclear whether the significant increase of the July to September 2023 quarter will continue, or whether this is like historical patterns before COVID-19 where we saw increases in complaints in line with seasonal usage.
Table 3: Detailed breakdown of complaints received by provider type.