Complaints received (all industries)
July to September 2024 – July to September 2025
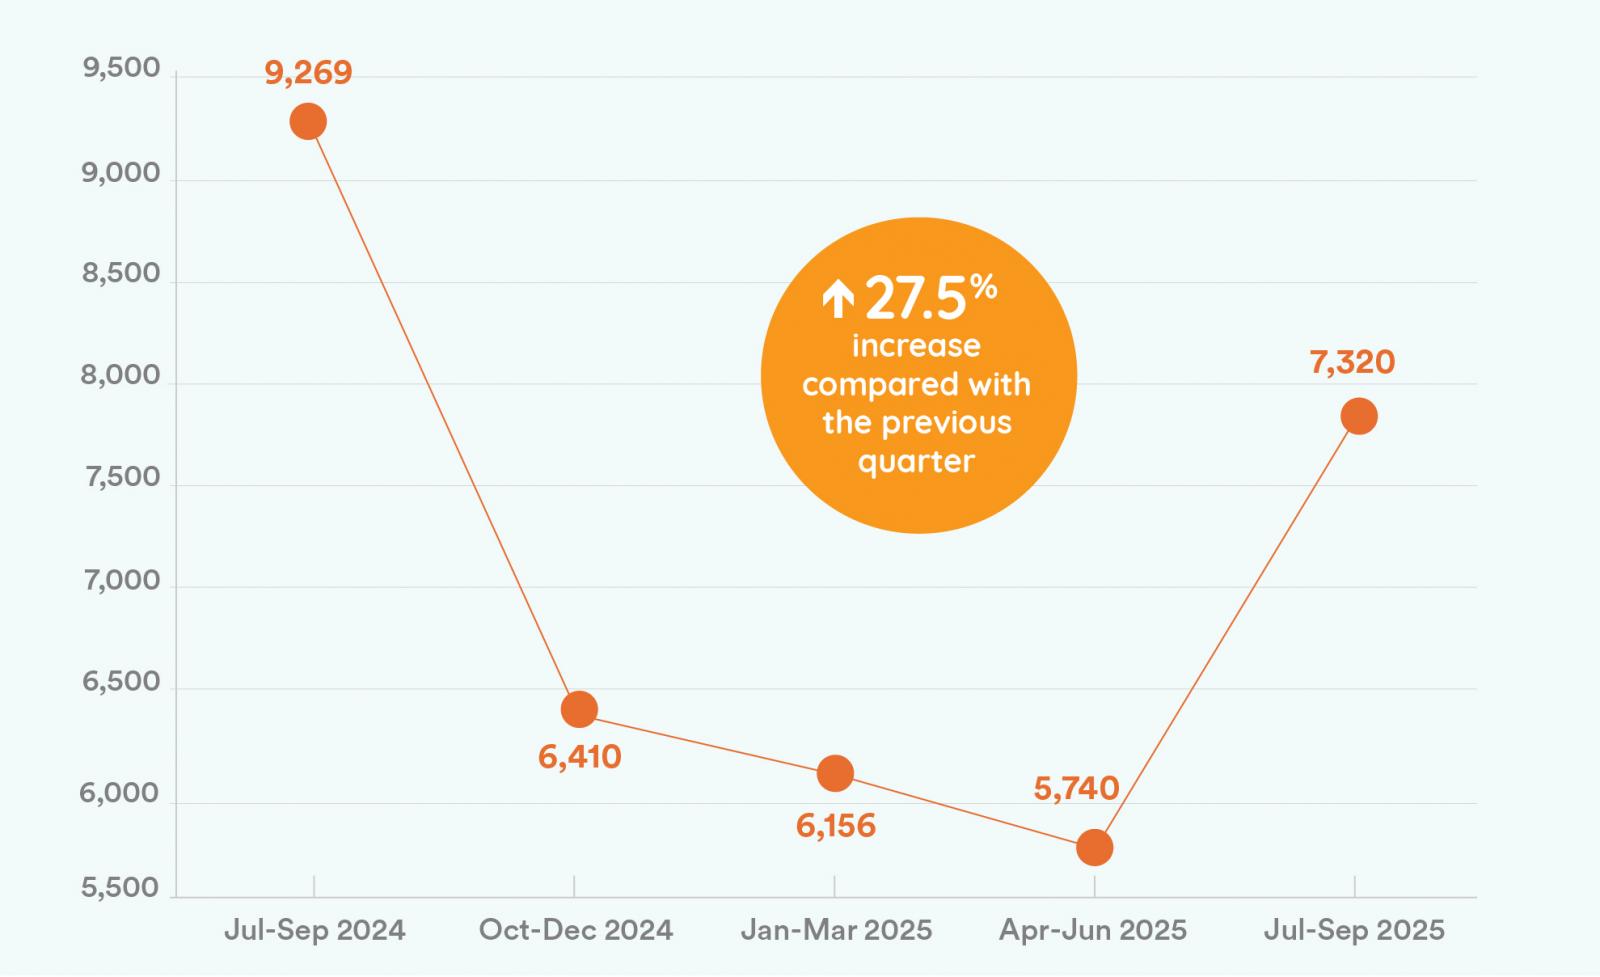
After a downward trend for three quarters, complaints received in July to September 2025 increased by 27.5% compared to the previous quarter. However, they did not spike to the same extent as complaints in July to September 2024, being 21.0% lower in comparison. We commonly see an increase in complaints in July to September with customers starting to receive their winter bills, combined with many customers experiencing price increases from 1 July. Based on previous year trends, we may see complaints reduce further in subsequent quarters. However, there are other factors that could continue to drive complaints, such as those explored in the water and embedded network sections below.
Complaints by industry
July to September 2025
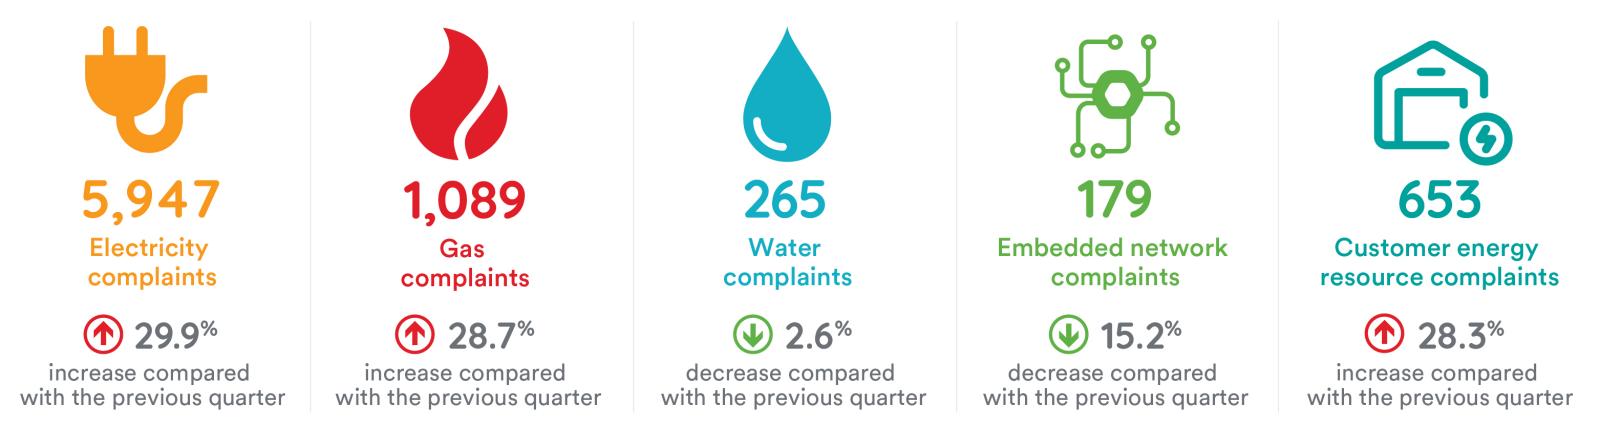
Complaints received by industry
July to September 2025
|
Case subject |
Provider type |
Apr – Jun 25 |
|
|---|---|---|---|
|
Electricity |
Exempt retailer |
42 |
|
|
Electricity |
Network |
312 |
|
|
Electricity |
Retailer |
5,488 |
|
|
Electricity |
Not allocated |
105 |
|
|
Electricity total |
|
5,947 |
|
|
Gas |
Network |
52 |
|
|
Gas |
Retailer |
1,011 |
|
|
Gas |
Not allocated |
26 |
|
|
Gas total |
|
1,089 |
|
|
Water |
Network |
53 |
|
|
Water |
Retailer |
156 |
|
|
Water |
Not allocated |
56 |
|
|
Water total |
|
265 |
|
|
Non-energy/ non-water total |
|
19 |
|
|
Grand total |
7,320 |
||
Customer complaint issues
High bills remained the most common complaint issue and increased as an overall percentage of core issues raised from 27.20% to 35.71% compared to the April to June 2025 quarter. This increase, coupled with complaints about variations in price or contract terms re-entering the Top 10 core issues for the first time in over a year, indicates that energy price increases from 1 July 2025 were likely a complaint driver for the quarter.
Top 10 core issues closed including the previous four quarters
July to September 2025
|
Primary issues |
Secondary > tertiary issues |
Jul 25 – Sep 25 |
Apr 25 – Jun 25 |
Jan 25 – Mar 25 |
Oct 24 – Dec 24 |
Jul 24 – Sep 24 |
|---|---|---|---|---|---|---|
|
Billing |
High > disputed |
2,577 35.71% |
1,592 27.20% |
1,911 30.43% |
2,349 35.80% |
3,407 |
|
General |
Energy / water |
305 4.23% |
146 2.49% |
130 2.07% |
159 2.42% |
228 2.50% |
|
Billing |
Error > payment |
215 2.98% |
183 3.13% |
217 3.46% |
199 3.03% |
250 2.74% |
|
Billing |
Rebate / concession > error |
211 2.92% |
139 2.38% |
124 1.97% |
168 2.56% |
288 3.16% |
|
Billing |
Estimation > meter access / not read |
199 2.76% |
214 3.66% |
248 3.95% |
250 3.81% |
356 3.90% |
|
Billing |
Account closing > error |
163 2.26% |
174 2.97% |
144 2.29% |
162 2.47% |
181 1.98% |
|
Credit |
Payment difficulties > current / arrears |
161 2.23% |
129 2.20% |
126 2.01% |
82 1.25% |
139 1.52% |
|
Billing |
Backbill |
124 1.72% |
146 2.49% |
119 1.90% |
142 2.16% |
199 |
|
Billing |
Error > cross-metering |
109 1.51% |
65 1.11% |
63 1.00% |
72 1.10% |
83 0.91% |
|
Billing |
Contract terms > variation in price / terms |
108 1.50% |
1.04%
|
71 1.13% |
89 1.36% |
125 1.37% |
Small business complaints
We received 327 complaints from small business customers in the July to September 2025 quarter, which is 4.5% of overall complaints. The majority of small business complaints were about electricity at 85%, with 9% about gas and 6% about water. This is similar to the industry breakdown of overall complaints. There were no small business complaints about the energy transition this quarter.
Top 5 small business core issues closed
July to September 2025
|
Core complaint issues |
Number |
|---|---|
|
Billing > high > disputed |
117 |
|
Billing > estimation > meter access / not read |
16 |
|
Billing > error > cross-metering |
15 |
|
Credit > disconnection / restriction > Impending |
15 |
|
Billing > backbill |
14 |
Water complaints
We received 265 water complaints this quarter, a small decrease of 2.6% compared to the previous quarter and 1.9% compared to the July to September 2024 period. This indicates that Hunter Water price increases from 1 July 2025 have not had an impact on water complaint numbers at this stage. We will continue to monitor the impact of these increases as more customers receive their bills with the new rates. Sydney Water price increases commenced from 1 October 2025, and we anticipate this may also impact water complaints numbers in the coming months.
Top five water core issues closed
July to September 2025
|
Complaint issues |
Number |
|---|---|
|
Billing > high > disputed |
73 |
|
General > water |
67 |
|
Supply > water licensing |
20 |
|
Land > property damage / restoration |
12 |
|
Supply > sewer overflow / blockage |
9 |
Embedded network complaints
This quarter EWON received 179 complaints from embedded network customers, a decrease of 15.2% on the previous quarter and 34.2% down from the same quarter last year.
Recent developments in the embedded network space have the potential to impact complaint numbers over the second half of 2025 and into 2026, including:
-
an increase in the maximum allowable electricity prices in land lease communities from 25 September 2025
-
the industry working towards compliance with the NSW Government Embedded Network Action Plan and Ministerial Statement of Expectations: Protecting customers of embedded networks.
Embedded network complaints by service provider
July to September 2025
|
Service provider |
Complaints by embedded network customers |
|---|---|
|
Electricity > network > exempt |
22 |
|
Electricity > retail > authorised |
92 |
|
Electricity > retail > exempt |
39 |
|
Gas > retail > authorised |
25 |
|
Gas > network > exempt |
1 |
|
Total |
179 |
Top five embedded network core issues closed
July to September 2025
|
Core complaint issues |
Complaints |
|---|---|
|
Billing > high > disputed |
54 |
|
Billing > contract terms > variation in price / terms |
9 |
|
Billing > contract terms > price increases |
8 |
|
Billing > fees & charges > service availability |
8 |
|
Billing > rebate / concession > error |
8 |
Consumer energy resources complaints
This quarter we received 653 consumer energy resources (CER) complaints, an increase of 28.3% compared to the previous quarter but a decrease of 22.5% when compared to the equivalent quarter last year. Complaints from customers using CER made up 10.9% of EWON’s overall complaints about electricity for the quarter. They made up 11% of electricity complaints in the April to June 2025 quarter. This indicates that the increase of 28.3% is in line with the overall 29.9% increase in electricity complaints, as the proportion of CER complaints remains almost the same.
Complaints received involving ‘behind the meter’ products by service provider
July to September 2025
|
Service provider |
Complaints opened involving behind the meter products |
|---|---|
|
Electricity > network > authorised |
20 |
|
Electricity > network > exempt |
1 |
|
Electricity > not allocated |
72 |
|
Electricity > retail > authorised |
560 |
|
Total |
653 |
Top five core issues for closed complaints involving consumer energy resources
July to September 2025
|
Core complaint issue |
Total |
|---|---|
|
Billing > high > disputed |
272 |
|
Billing > tariff > feed-in |
44 |
|
Digital meter exchange > fault > solar connection |
26 |
|
Consumer Energy Resource > system performance > fault |
22 |
|
Consumer Energy Resource > installation / connection > not to agreement |
20 |
Renewable Energy Infrastructure complaints
Complaints about renewable energy infrastructure in Jul – Sept 202
|
Complaints by level Total: 15
|
Complaints breakdown by area
|
Complaints by type
* These complaints are out of jurisdiction, we generally refer them to the Australian Energy Infrastructure Commissioner. |
Complaint issue for renewable energy infrastructure complaints
|
Complaint issue |
Total |
|---|---|
|
General > energy (referrals – out of jurisdiction) |
6 |
|
Land> network / transmission assets > placement |
4 |
|
Supply > off supply (planned) |
2 |
|
Customer service > failure to consult / inform |
2 |
|
Customer service > poor unprofessional attitude |
1 |
|
Total |
15 |