-
Home
-
Publications and submissions
-
Reports
-
EWON Insights
-
EWON Insights Oct-Dec 2020
- Complaint activity
Complaint activity
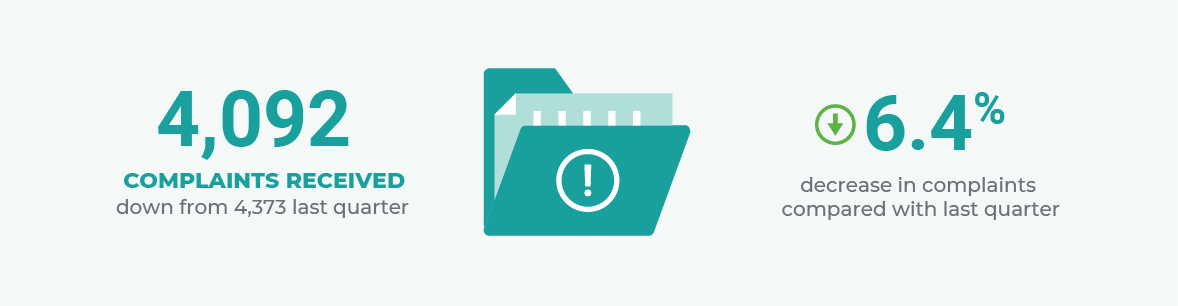
Complaints received this quarter decreased by 6.4% to 4,092 (down from 4,373 last quarter), owing to decreased complaints from electricity and gas customers. We believe this was partly due to the reintroduction of a partial COVID-19 lockdown in December, combined with the holiday period. The restrictions on various credit activities by the AER in its Statement of Expectations remained in place and this perhaps explains the decline of complaints compared to last year.
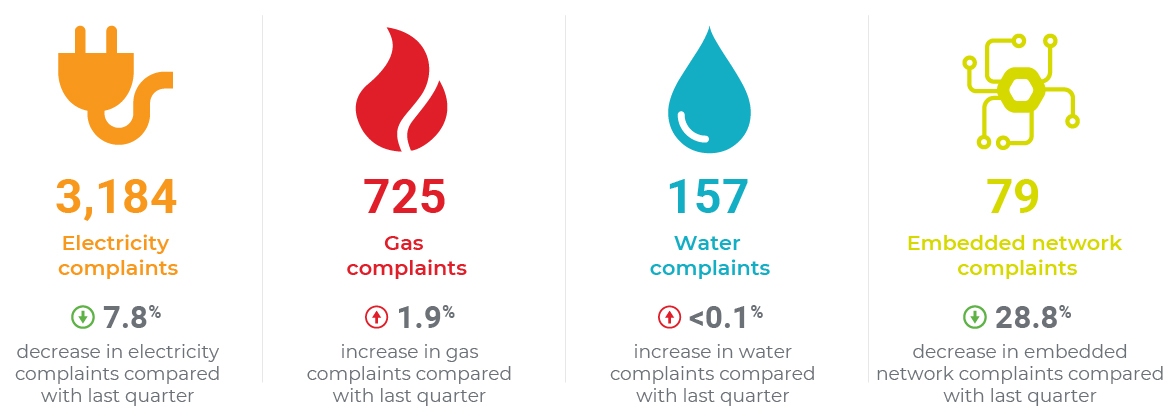
Electricity: Total electricity complaints of 3,184 fell by 7.8% compared to the previous quarter. The 2,875 electricity retail complaints we received during the period represents an 8.7% decrease on last quarter’s 3,149 complaints. Network complaints increased by 6.4%, with 267 complaints compared to 251 in the previous quarter.
Gas: At 725, overall gas complaints were 1.9% lower compared to 739 complaints received last quarter. The number of gas retail complaints received during the quarter (680) increased by 1.0% compared with the previous quarter (673). The number of gas network complaints (30) decreased by 20 from the last quarter.
Water: We received 157 water complaints this quarter, just one more than last quarter.
The graph below shows complaints in Oct-Dec 2020 compared with Jul-Sep 2020. An accessible version of this information is provided in the table below.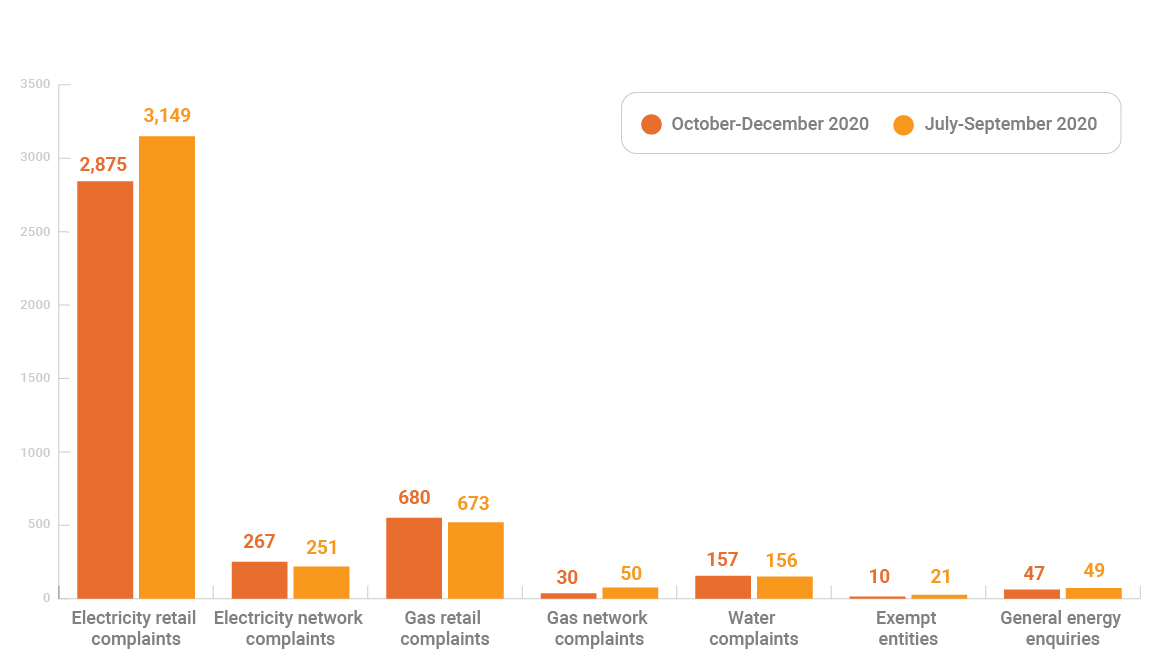
Table 1 - Complaint activity for previous two quarters (Oct-Dec 2020 and Jul-Sep 2020)
| Complaint category | Oct-Dec 2020 | Jul-Sep 2020 |
|---|---|---|
| Electricity retail | 2,875 | 3,149 |
| Electricity network | 267 | 251 |
| Gas retail | 680 | 673 |
| Gas network | 30 | 50 |
| Water | 157 | 156 |
| Exempt energy retailers | 10 | 21 |
| General enquiries | 47 | 49 |
| Total | 4,092 | 4,373 |
Tables 2 to 5 provide detailed information about the number of complaints received from October to December 2020 compared to the previous four quarters.
| Case subject | Provider type | Oct-Dec 2020 | Jul – Sep 2020 | Apr – Jun 2020 | Jan – Mar 2020 | Oct – Dec 2019 |
|---|---|---|---|---|---|---|
| Electricity | Exempt retailer | 10 | 21 | 12 | 14 | 18 |
| Electricity | Network | 267 | 251 | 259 | 368 | 235 |
| Electricity | Retailer | 2,875 | 3,149 | 2,658 | 3,457 | 3,764 |
| Electricity | Not allocated | 32 | 33 | 63 | 101 | 80 |
| Electricity | Total | 3,184 | 3,454 | 2,992 | 3,940 | 4,097 |
| Case subject | Provider type | Oct - Dec 2020 | Jul– Sep 2020 | Apr – Jun 2020 | Jan – Mar 2020 | Oct – Dec 2019 |
|---|---|---|---|---|---|---|
| Gas | Exempt retailer | 0 | 0 | 0 | 0 | 1 |
| Gas | Network | 30 | 50 | 21 | 31 | 42 |
| Gas | Retailer | 680 | 673 | 520 | 658 | 755 |
| Gas | Not allocated | 15 | 16 | 10 | 8 | 12 |
| Gas | Total | 725 | 739 | 551 | 697 | 810 |
| Case subject | Provider type | Oct - Dec 2020 | Jul – Sep 2020 | Apr – Jun 2020 | Jan – Mar 2020 | Oct – Dec 2019 |
|---|---|---|---|---|---|---|
| Non-energy/non-water | Not allocated | 26 | 24 | 15 | 22 | 20 |
| Non-energy/non-water | Total | 26 | 24 | 15 | 22 | 20 |
| Case subject | Provider type | Oct - Dec 2020 | Jul – Sep 2020 | Apr – Jun 2020 | Jan – Mar 2020 | Oct – Dec 2019 |
|---|---|---|---|---|---|---|
| Water | Network | 47 | 44 | 74 | 85 | 65 |
| Water | Retailer | 80 | 92 | 99 | 129 | 118 |
| Water | Not Allocated | 30 | 20 | 18 | 24 | 17 |
| Water | Total | 157 | 156 | 191 | 238 | 200 |