-
Home
-
Publications and submissions
-
Reports
-
EWON Insights
-
EWON Insights Oct-Dec 2025
- Complaints Oct - Dec 2025
Complaints Oct - Dec 2025
Complaints this quarter
October-December 2024 to October-December 2025
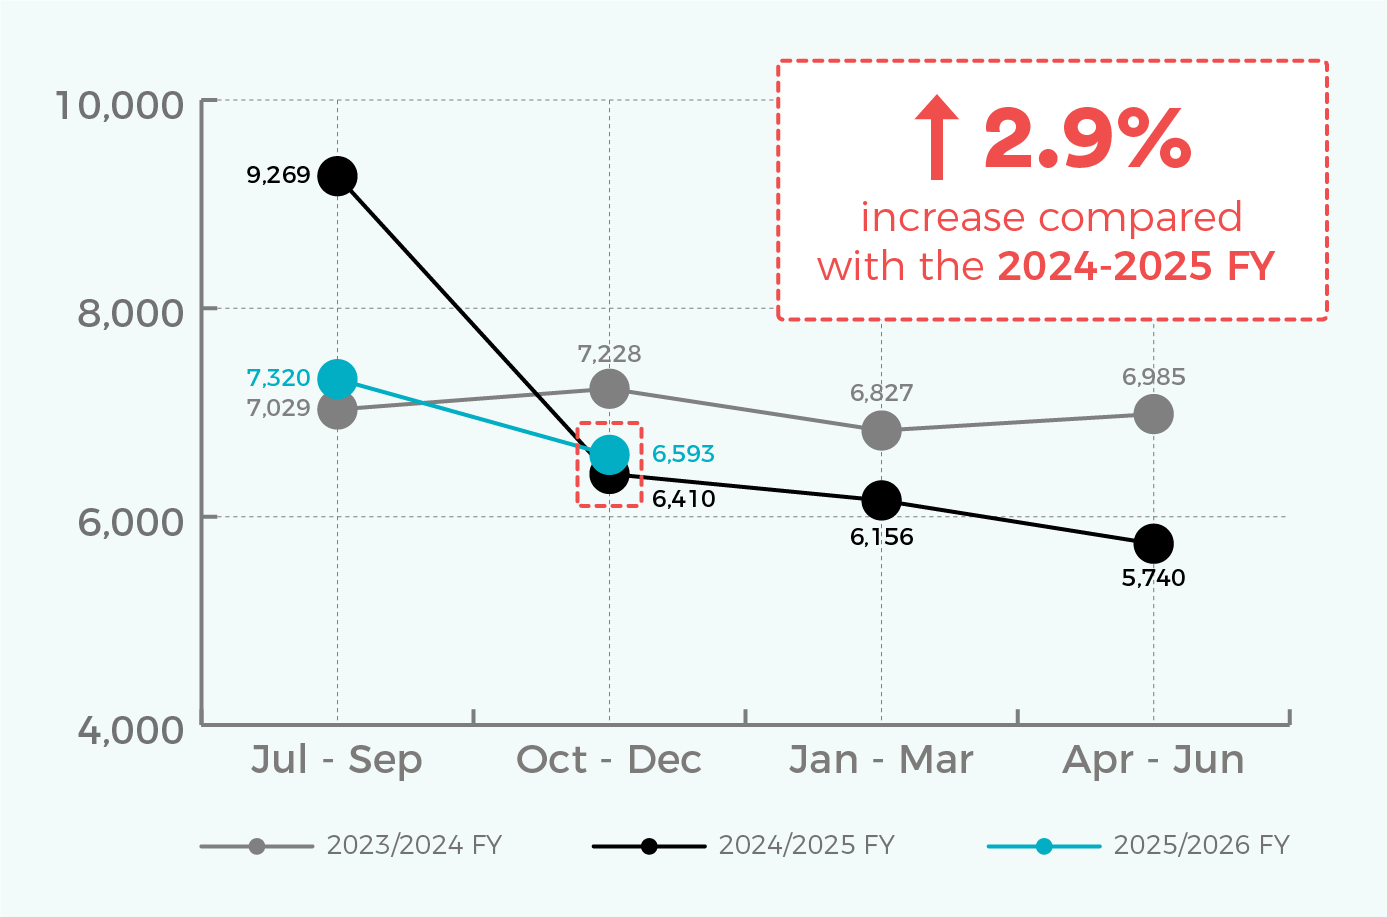
Complaint numbers for the October to December 2025 quarter dropped by 9.9%, which is the usual pattern after a peak in the July to September 2025 quarter (which includes winter bills). Complaint numbers this quarter were very similar to the same time last year, only 2.9% higher than the October to December 2024 quarter. If past trends continue, they will plateau our trend downwards for the next two quarters. However, many factors have the potential to impact complaint trends over the coming months, such as the accelerated smart meter rollout.
Complaints by industry
Complaints received by industry
October to December 2025
|
Industry |
Provider type |
Oct 25 – Dec 25 |
|---|---|---|
|
Water |
Retail |
128 |
|
Water |
Network |
73 |
|
Water |
Not allocated |
42 |
|
Water – total |
|
243 |
|
Electricity |
Retail |
4,811 |
|
Electricity |
Network |
373 |
|
Electricity |
Exempt retailer |
50 |
|
Electricity |
Not allocated |
104 |
|
Electricity total |
|
5,338 |
|
Gas |
Retail |
924 |
|
Gas |
Network |
42 |
|
Gas |
Exempt retailer |
4 |
|
Gas |
Not allocated |
20 |
|
Gas total |
|
990 |
|
Non-energy/non-water total |
|
22 |
|
Grand Total |
|
6,593 |
Customer complaint issues
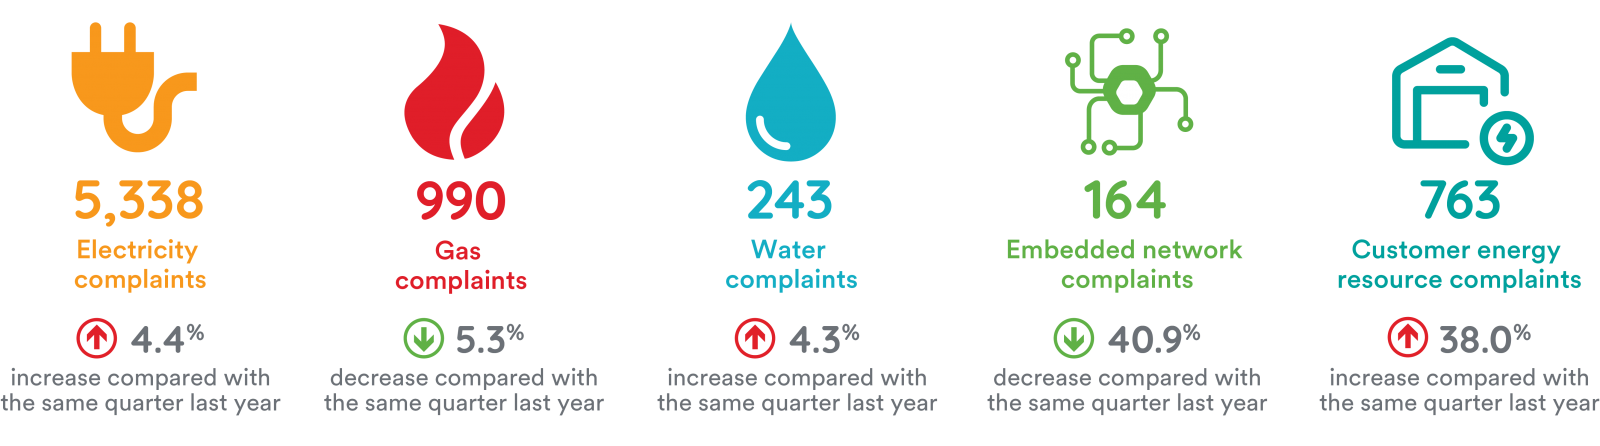
High bills remained the most common complaint issue this quarter. Billing issues with estimations and backbills, payment/refund issues and account opening/closing issues also remained in the top ten.
Two less common issues also entered the top ten this quarter. The first were complaints from customers who experienced loss or damage (typically to appliances) following an unplanned electricity outage. These complaints tripled compared to the June to September 2025 quarter, largely driven by extreme weather events that impacted parts of NSW in October 2025 and November 2025.
The second was complaints from customers who received a written notice from their retailer warning that they were at risk of disconnection. In these cases, EWON's first priority is to work with customers and retailers to address the impending disconnection. We then assess the best next steps for any underlying or related complaint issues. Complaints about payment difficulties narrowly missed the top ten, suggesting that affordability issues may have driven the increase in disconnection risk complaints.
With ongoing cost of living pressures, households face difficulty keeping on top of electricity charges and other essential expenses. In response to these challenges, EWON has recommended that the NSW Government consider funding for a permanent energy debt relief scheme for NSW residential customers experiencing vulnerability.
Top 10 core issues closed including the previous four quarters
October to December 2024 - October to December 2025
|
Primary issues |
Secondary > tertiary issues |
Oct 25 – Dec 25 |
Jul 25 – Sep 25 |
Apr 25 – Jun 25 |
Jan 25 – Mar 25 |
Oct 24 – Dec 24 |
|---|---|---|---|---|---|---|
|
Billing |
High > disputed |
2,372 36.49% |
2,577 35.71% |
1,592 27.20% |
1,911 30.43% |
2,349 35.80% |
|
Billing |
Estimation > meter access / not read |
207 3.18% |
199 2.76% |
214 3.66% |
248 3.95% |
250 3.81% |
|
Billing |
Error > payment |
194 2.98% |
215 2.98% |
183 3.13% |
217 3.46% |
199 3.03% |
|
Billing |
Account closing > error |
160 2.46% |
16 2.26% |
174 2.97% |
144 2.29% |
162 2.47% |
|
General |
Energy / water |
143 2.20% |
305 4.23% |
146 2.49% |
130 2.07% |
159 2.42% |
|
Billing |
Account opening > error |
139 2.14% |
91 1.26% |
125 2.14% |
115 1.83% |
95 1.45% |
|
Billing |
Refund or credit > delay / error / form |
133 2.05% |
89 1.23% |
150 2.56% |
158 2.52% |
188 2.87% |
|
Supply |
Off supply (unplanned) > damage / loss |
125 1.92% |
41 0.57% |
46 0.79% |
70 1.12% |
28 0.43% |
|
Billing |
Backbill |
115 1.77% |
124 1.72% |
146 2.49% |
119 1.90% |
142 2.16% |
|
Credit |
Disconnection / restriction > impending |
115 1.77% |
75 1.04% |
92 1.57% |
72 1.15% |
79 1.21% |
Water complaints
Water complaints represented 3.7% of EWON’s overall complaints this quarter, which is consistent with usual levels. EWON anticipated that Hunter Water price increases from 1 July 2025 and Sydney Water price increases from 1 October 2025 may drive a rise in water complaints in the October to December 2025 quarter. Water complaints were 4.1% higher than the October to December 2024 quarter, however decreased by 8.3% compared to the July to September 2025 quarter. We will continue to monitor the impact of planned price increases over the next five years.
EWON has recommended that the NSW Government consider the findings of the NSW Productivity and Equality Commission’s Review of funding models for local water utilities Final report (July 2024). We recommended that NSW Government consider appropriate funding for an updated water customer affordability scheme for pension holders that ensures:
-
households experiencing financial vulnerability can manage the significant price increases for water services over the next five years
-
the scheme also applies to customer groups, such as tenants, that are currently ineligible for pensioner rebates for water services
-
where possible, all water customers – including those serviced by local government authorities – have access to an equivalent level of pensioner rebates.
Top five water core issues closed
October to December 2025
|
Issue |
Number |
|---|---|
|
Billing > high > disputed |
68 |
|
General > water |
46 |
|
Supply > quality |
13 |
|
Supply > sewer overflow / blockage |
12 |
|
Land > property damage / restoration |
10 |
Embedded network complaints
EWON experienced an increase in embedded network complaints last year in the October to December 2024 quarter. This increase followed major changes to the way energy is charged in residential land lease communities (a type of embedded network) from 25 September 2024. More detail is available in EWON’s previous Insights report: EWON Insights Jan-Mar 2025 - Energy & Water Ombudsman NSW.
Given this trend, we anticipated that there may be a similar increase in the October to December 2025 quarter, as the maximum prices for residential land lease communities increased on 25 September 2025. However, this quarter EWON received 164 complaints from embedded network customers, a decrease of 8.4% on the previous quarter. This was 40.9% lower than embedded network complaints in the October to December 2024 quarter. The spike in the October to December 2024 quarter was driven by residential land lease communities customers experiencing an entirely new pricing approach. By contrast, in the October to December 2025 quarter, customers were dealing with a more straightforward price increase, which did not drive complaints to the same extent.
There will be a lot happening in the embedded network space in 2026 with the potential to impact future complaint numbers, as the NSW Government works to take forward its NSW Government Embedded Network Action Plan.
Embedded network complaints by service provider
October to December 2025
|
Service provider |
Number |
|---|---|
|
Retail |
99 |
|
Exempt retailer |
51 |
|
Network |
13 |
|
Not allocated |
1 |
|
Total |
164 |
Top five embedded network core issues closed
October to December 2025
|
Issue |
Number |
|---|---|
|
Billing > high > disputed |
48 |
|
Billing > tariff > rate |
13 |
|
Billing > contract terms > variation in price / terms |
6 |
|
Billing > contract terms > price increases |
6 |
|
Billing > refund or credit > delay / error / form |
6 |
Consumer energy resources complaints
This quarter we received 763 consumer energy resources (CER) complaints, making up 14.3% of EWON’s overall complaints about electricity for this quarter – higher than the usual 10-11% we have seen in recent quarters. While overall electricity complaints decreased by 10.2% compared to the previous quarter, CER complaints increased by 16.8%. Compared with the same quarter last year, electricity complaints increased slightly by 4.4% whereas CER complaints increased significantly by 38.0%. We will see over the next few quarters whether this is the start of an upward trend in CER related complaints.
The increase in CER complaints this quarter highlights the importance of ongoing work by the NSW Government to implement its NSW Consumer Energy Strategy. This includes ensuring EWON’s jurisdiction for CER remains fit for purpose and keeps up with evolving products and services.
Complaints received involving ‘behind the meter’ products by service provider
October to December 2025
|
Service provider |
Number |
|---|---|
|
Retail |
653 |
|
Exempt retailer |
4 |
|
Network |
18 |
|
Exempt network |
2 |
|
Not allocated |
86 |
|
Total |
763 |
Top five core issues for closed complaints involving consumer energy resources
October to December 2025
|
Core complaint issue |
Total |
|---|---|
|
Billing > high > disputed |
260 |
|
Billing > tariff > feed-in |
54 |
|
Digital meter exchange > fault > solar connection |
38 |
|
Consumer energy resource > system performance > fault |
33 |
|
Consumer energy resource > system performance > product performance |
21 |