-
Home
-
Publications and submissions
-
Reports
-
EWON Insights
-
EWON Insights Jan-Mar 2026
- Complaints this quarter
Complaints this quarter
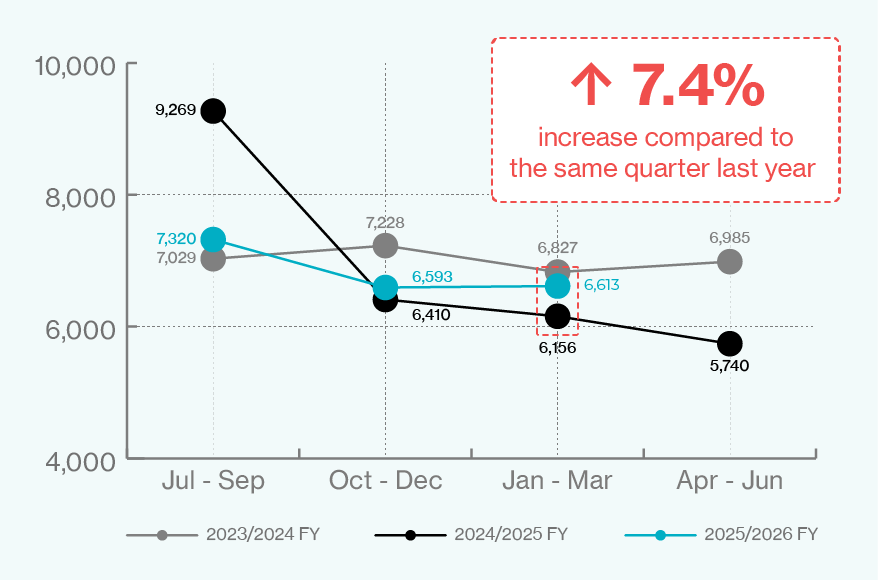
Complaints received (all industries)
January-March 2025 to January-March 2026
Complaint numbers for the January to March 2026 quarter continued at an elevated level compared to the same quarter in 2025. Complaints that factor in consumer energy resources (CER) such as rooftop solar and batteries have significantly increased and this may have links to the rollout of residential batteries through the Commonwealth Government’s cheaper home battery program.
Complaints by industry
Complaints received by industry
January to March 2026
|
Industry |
Provider type |
Jan 26 – Mar 26 |
|---|---|---|
|
Electricity |
Retail |
5,032 |
|
Electricity |
Network |
290 |
|
Electricity |
Exempt retailer |
34 |
|
Electricity |
Not allocated |
112 |
|
Electricity total |
|
5,468 |
|
Gas |
Retail |
820 |
|
Gas |
Network |
26 |
|
Gas |
Exempt retailer |
1 |
|
Gas |
Not allocated |
24 |
|
Gas total |
|
871 |
|
Water |
Retail |
156 |
|
Water |
Network |
68 |
|
Water |
Not allocated |
32 |
|
Water – total |
|
256 |
|
Non-energy/non-water total |
|
18 |
|
Grand total |
|
6,613 |
Customer complaint issues
High bills remained the most common complaint issue this quarter. Eight of the top ten core complaint issues were about billing. A credit issue relating to payment difficulties also featured in the top ten. It is no surprise that billing and credit issues remain the main drivers of complaints. New South Wales households were already dealing with cost-of-living pressures, before petrol and diesel prices dramatically increased this quarter.
Top 10 core issues closed including the previous four quarters
January to March 2025 – January to March 2026
|
Primary issues |
Secondary > tertiary issues |
Jan 26 – Mar 26 |
Oct 25 – Dec 25 |
Jul 25 – Sep 25 |
Apr 25 – Jun 25 |
Jan 25 – Mar 25 |
|---|---|---|---|---|---|---|
|
Billing |
High > disputed |
2,096 33.15% |
2,372 36.49% |
2,707 37.67% |
1,595 27.26% |
1,911 30.44% |
|
Billing |
Account closing > error |
208 3.29% |
160 2.46% |
168 2.34% |
174 2.97% |
144 2.29% |
|
Billing |
Estimation > meter access / not read |
204 3.23% |
207 3.18% |
202 2.81% |
214 3.66% |
248 3.95% |
|
Billing |
Error > payment |
188 2.97% |
194 2.98% |
222 3.09% |
184 3.14% |
217 3.46% |
|
General |
Energy / water |
152 2.40% |
143 2.20% |
152 2.11% |
147 2.51% |
129 2.05% |
|
Billing |
Information |
128 2.02% |
77 1.18% |
85 1.18% |
146 2.50% |
150 2.39% |
|
Billing |
Backbill |
128 2.02% |
115 1.77% |
119 1.66% |
145 2.48% |
119 1.90% |
|
Billing |
Rebate / concession > error |
125 1.98% |
107 1.65% |
215 2.99% |
139 2.38% |
124 1.98% |
|
Credit |
Payment difficulties > current / arrears |
102 1.61% |
107 1.65% |
180 2.50% |
129 2.20% |
126 2.01% |
|
Billing |
Refund or credit > delay / error / form |
92 1.46% |
133 2.05% |
89 1.24% |
150 2.56% |
158 2.52% |
Water complaints
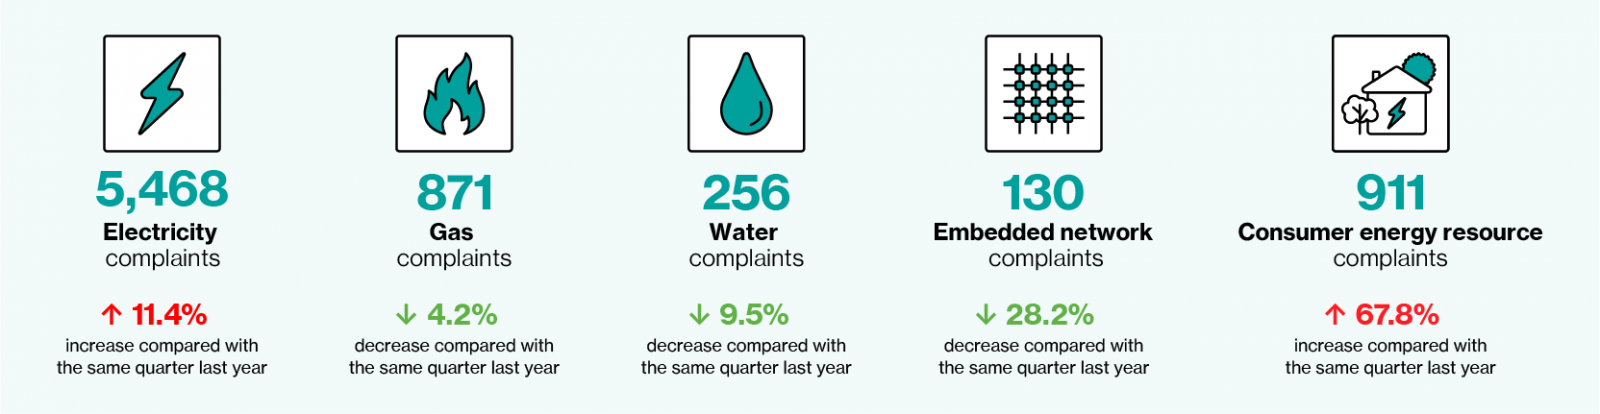
Water complaints increased compared to last quarter, with 256 complaints received. High bills remain the primary cause of complaints. Water complaints represented 3.9% of EWON’s overall complaints this quarter, which is a typical proportion.
Top five water core issues closed
January to March 2026
|
Issue |
Number |
|---|---|
|
Billing > high > disputed |
66 |
|
General > energy / water |
39 |
|
Supply > sewer overflow / blockage |
10 |
|
Land > network / transmission assets > maintenance |
8 |
|
Supply > quality |
3 |
Embedded network complaints
EWON received only 130 embedded network complaints this quarter - a significant decrease (almost 30%) on the number received in the same quarter the previous year. This follows a recent trend of falling embedded network complaints each quarter.
Embedded network complaints by service providers
January to March 2026
|
Service provider |
Number |
|---|---|
|
Retail |
90 |
|
Exempt retailer |
32 |
|
Network |
6 |
|
Not allocated |
2 |
|
Total |
130 |
Top five embedded network core issues closed
January to March 2026
|
Issue |
Number |
|---|---|
|
Billing > high > disputed |
45 |
|
Billing > fees and charges > service availability |
5 |
|
Billing > rebate / concession > error |
2 |
|
Billing > rebate / concession > information |
1 |
|
Billing > delay |
4 |
Consumer energy resources complaints
EWON received 911 electricity complaints where the customer mentioned that consumer energy resources (CER) were a factor in their complaint. This includes technologies like rooftop solar and residential batteries.
The second highest core complaint issue related to the performance of the customer’s CER system, specifically that there was a fault with the technology.
This increase in complaints related to CER is likely related to the significant uptake of rooftop solar systems and residential batteries after the launch of the Commonwealth Government’s Cheaper Home Batteries Program. From 1 May 2026, the rebate for solar batteries will:
- decline every six months at a higher rate
- be tiered based on battery system size.
This will impact the number of small-scale technology certificates a solar battery may be eligible for, particularly for larger sized systems. We anticipate that these changes to the Commonwealth scheme may drive new complaints across the energy sector.
Complaints received involving consumer energy resources by service provider
January to March 2026
|
Service provider |
Number |
|---|---|
|
Retail |
796 |
|
Exempt retailer |
5 |
|
Network |
10 |
|
Not allocated |
100 |
|
Total |
911 |
Top five core issues for closed complaints involving consumer energy resources
January to March 2026
|
Core complaint issue |
|
Total |
|
|---|---|---|---|
|
Billing |
High > disputed |
298 |
|
|
Consumer energy resource |
System performance > fault |
49 |
|
|
Billing |
Tariff > feed-in |
47 |
|
|
Digital meter exchange |
Delay |
34 |
|
|
Billing |
Estimation > meter access / not read |
26 |
|