-
Home
-
Publications and submissions
-
Reports
-
EWON Insights
-
EWON Insights Apr-Jun 2026
- Complaints this quarter
Complaints this quarter
Complaints received (all industries)
April to June 2025 – April to June 2026
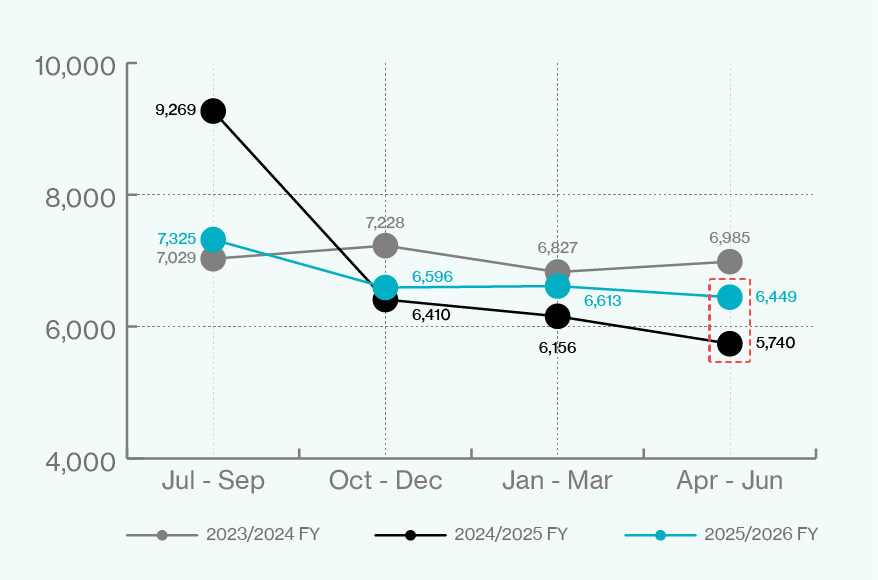
Complaint numbers for the April to July 2026 quarter continued at an elevated level compared to the same quarter in 2025, up 12.25%. However, complaints numbers are down 2.48% compared to the January to March 2026 quarter. Complaints that factor in consumer energy resources (CER) also remained elevated.
Complaints received by industry
April to June 2025 – April to June 2026
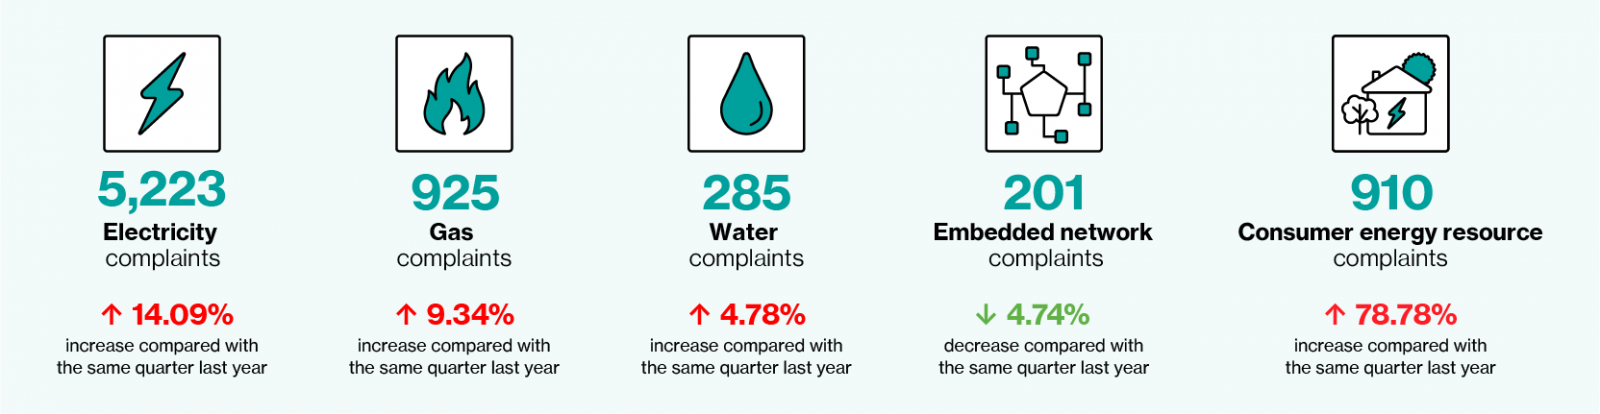
Complaints received by industry
April to June 2026
|
Industry |
Provider type |
Apr 26 – Jun 26 |
|---|---|---|
|
Electricity |
Retail |
4,814 |
|
Electricity |
Network |
229 |
|
Electricity |
Not allocated |
135 |
|
Electricity |
Exempt retailer |
45 |
|
Electricity total |
5,223 |
|
|
Gas |
Retail |
852 |
|
Gas |
Network |
46 |
|
Gas |
Not allocated |
26 |
|
Gas |
Exempt retailer |
1 |
|
Gas total |
924 |
|
|
Water |
Retail |
163 |
|
Water |
Not allocated |
69 |
|
Water |
Network |
53 |
|
Water total |
285 |
|
|
Non energy / non water total |
16 |
|
Complaint issues
Cost of living pressures continued to drive complaints, with high bills remaining the most common complaint issue this quarter. Complaints about payment difficulties increased compared to the January to March 2026 quarter. Complaints about energy tariffs/rates re-entered the top 10.
Top 10 core issues closed including the previous four quarters
April to June 2025 – April to June 2026
|
Primary issues |
Secondary > tertiary issues |
Apr 26 – Jun 26 |
Jan 26 – Mar 26 |
Oct 25 – Dec 25 |
Jul 25 – Sep 25 |
Apr 25 – Jun 25 |
|---|---|---|---|---|---|---|
|
Billing |
high > disputed |
1,979 30.26% * |
2,096 33.15% |
2,372 36.49% |
2,707 37.67% |
1,595 27.26% |
|
Billing |
estimation > meter access / not read |
285 4.36% |
204 3.23% |
207 3.18% |
202 2.81% |
214 3.66% |
|
General |
energy / water |
206 3.15% |
152 2.40% |
143 2.20% |
152 2.11% |
147 2.51% |
|
Billing |
error > payment |
202 3.09% |
188 2.97% |
194 2.98% |
222 3.09% |
184 3.14% |
|
Billing |
account closing > error |
199 3.04% |
208 3.29% |
160 2.46% |
168 2.34% |
174 2.97% |
|
Billing |
delay |
151 2.31% |
179 2.83% |
112 1.72% |
101 1.41% |
105 1.79% |
|
Credit |
payment difficulties > current / arrears |
147 2.25% |
102 1.61% |
107 1.65% |
180 2.50% |
129 2.20% |
|
Billing |
tariff > rate |
142 2.17% |
125 1.98% |
113 1.74% |
102 1.42% |
69 1.18% |
|
Billing |
account opening > error |
135 2.06% |
139 2.20% |
139 2.14% |
91 1.27% |
125 2.14% |
|
Billing |
backbill |
127 1.94% |
128 2.02% |
115 1.77% |
119 1.66% |
145 2.48% |
* percentage of the total number of complaints received for that quarter
Water complaints
Water complaints increased compared to last quarter, with 285 complaints received. Water complaints represented 4.4% of EWON’s overall complaints this quarter, which is a typical proportion. Water complaints included disputes about:
-
high bills
-
customer classification, fees and charges
-
smart metering
-
connection issues
-
concealed leaks
-
credit, affordability, restriction
-
sewerage services
-
storm water infrastructure
-
water quality.
General and out of jurisdiction complaints
There were 81 ‘General’ water complaints closed. Most of these were matters that fell outside EWON's jurisdiction. These complaints were about other water providers that were not members of EWON during the period, including:
-
local government water authorities
-
social housing providers
-
irrigation corporations
-
real estate agents
-
residential developments, such as strata corporations or retirement villages
-
water providers outside NSW.
From 1 July 2026, we expanded our jurisdiction to provide free, fair and independent dispute resolution to customers of five irrigation corporations. However, this new jurisdiction had not commenced during this period.
Top five water core issues closed
April to June 2026
|
Issue |
Number |
|---|---|
|
General > energy / water |
81 |
|
Billing > high > disputed |
69 |
|
Land > property damage / restoration |
13 |
|
Supply > sewer overflow / blockage |
10 |
|
Billing > estimation > meter access / not read |
7 |
Embedded network complaints
EWON received 201 embedded network complaints this quarter, a significant increase of 54.62% compared to the preceding quarter, after several quarters of falling complaints.
Embedded network complaints by service providers
April to June 2026
|
Service provider |
Number |
|---|---|
|
Retail |
153 |
|
Exempt retailer |
44 |
|
Network |
4 |
|
Total |
201 |
Top five embedded network core issues closed
April to June 2026
|
Issue |
Number |
|---|---|
|
Billing > high > disputed |
49 |
|
Billing > tariff > rate |
14 |
|
Billing > account opening > error |
11 |
|
Billing > contract terms > price increases |
9 |
|
Billing > backbill |
9 |
Consumer energy resources complaints
EWON received 910 electricity complaints where the customer mentioned they were using consumer energy resources (CER). This represents a 78.78% increase compared to the same quarter the year before. It represents 17.42% of electricity complaints this quarter. For the same period in 2025, CER complaints represented 11.0% of all electricity complaints.
Complaints received involving consumer energy resources by service provider
April to June 2026
|
Service provider |
Number |
|---|---|
|
Retail |
775 |
|
Exempt retailer |
8 |
|
Network |
19 |
|
Not allocated |
108 |
|
Total |
910 |
Top five core issues for closed complaints involving consumer energy resources
April to June 2026
|
Issue |
Total |
|---|---|
|
Billing > high > disputed |
281 |
|
Consumer energy resource > system performance > fault |
58 |
|
Billing > tariff > feed-in |
52 |
|
Digital meter exchange > delay |
35 |
|
Consumer energy resource > installation/connection > non-compliant installation |
29 |