-
Home
-
Publications and submissions
-
Reports
-
EWON Insights
-
EWON Insights Jul-Sep 2026
- Complaints this quarter
Complaints this quarter
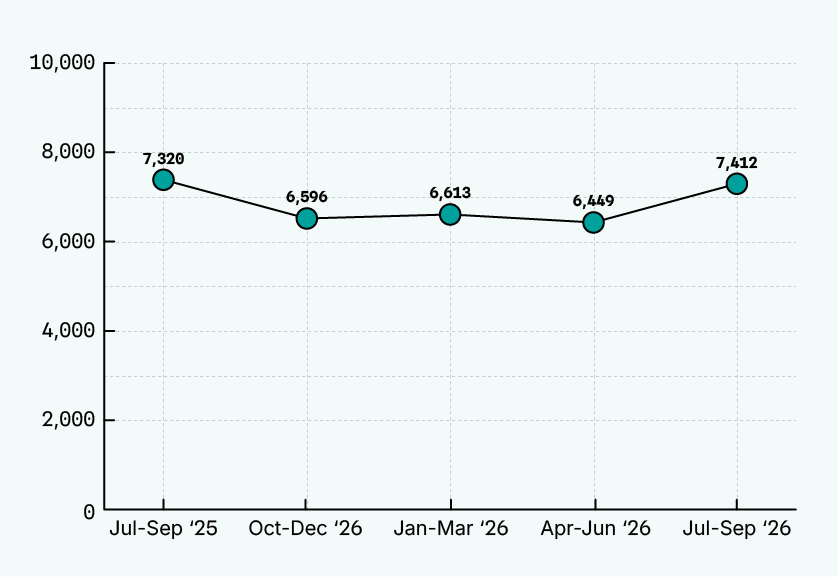
The Australian Energy Regulator’s (AER) determination of the Default Market Offer (DMO) meant that residential flat rate standing offer prices fell between 3.4% and 5.0% in New South Wales, from 1 July 2026. However, overall complaints numbers increased by 14.9% compared to April to June 2026, with complaints about high bill disputes increasing by 19.7% this quarter compared with the April to June 2026 quarter. These increases to complaints are because most customers are on market contracts – 92.6% of energy customers in NSW – and still exposed to increased prices.
Complaints to EWON also indicate that the fixed element of energy bills, often referred to as service to property charges, increased significantly for some customers. This resulted in an increase in complaints about the price of fixed charges on energy bills.
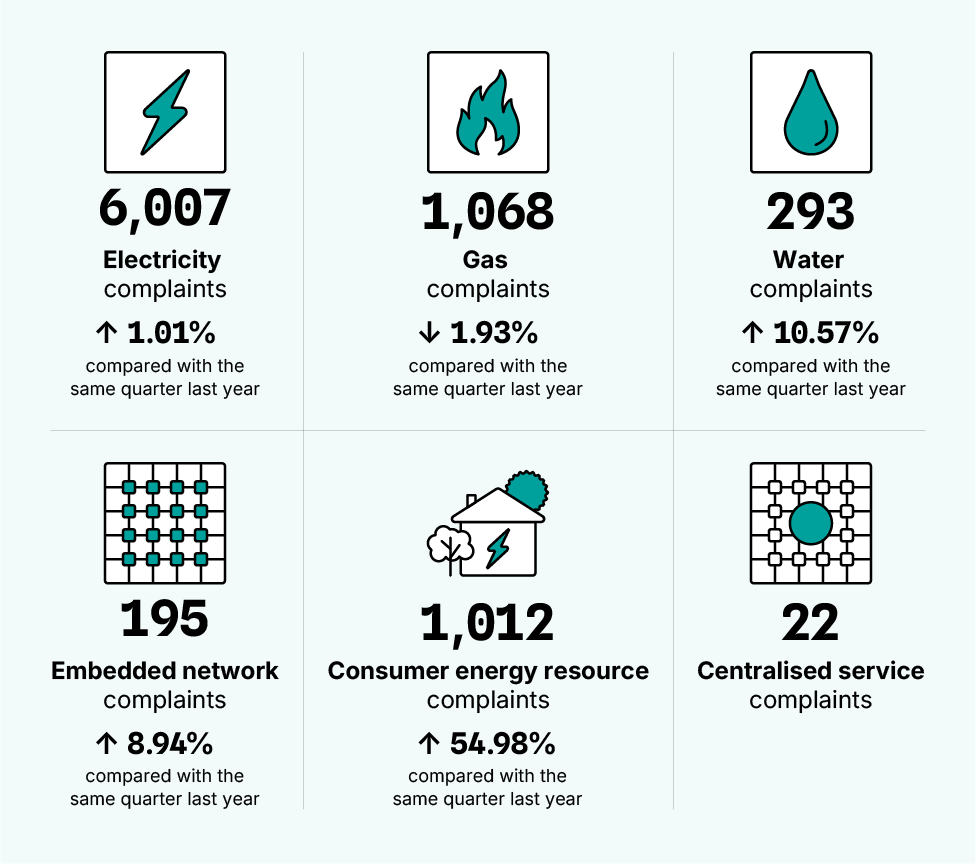
Complaints received by industry
Jul to Sep 2025 – Jul to Sep 2026
|
Industry |
Jul 26 – Sep 26 |
Percentage change Apr 26 – Jun 26 |
Percentage change Jul 25 – Sep 25 |
|---|---|---|---|
|
Electricity |
6,007 |
15.01% increase (5,223) |
1.01% increase (5,947) |
|
Gas |
1,068 |
15.46% increase (924) |
1.93% decrease (1,089) |
|
Water |
293 |
2.81% increase (285) |
10.57% increase (265) |
|
Centralised services* |
22 |
N/A |
N/A |
|
Embedded networks |
195 |
2.99% decrease (201) |
8.94% increase (179) |
|
Consumer energy resources |
1,012 |
11.21% increase (910) |
54.98% increase (653) |
* Centralised services are complaints about the sale of hot water or air conditioning in residential buildings. This industry category was introduced 1 July 2026 due to NSW specific changes to expand the application of the National Energy Retail Law (NSW) to the sale and supply of hot water and centralised air-conditioning.
Complaints received by industry
July to September 2026
|
Industry |
Provider type |
Jul 26 – Sep 26 |
|---|---|---|
|
Electricity |
Retail |
5,652 |
|
Electricity |
Network |
229 |
|
Electricity |
Not allocated |
78 |
|
Electricity |
Exempt retailer |
48 |
|
Electricity total |
6,007 |
|
|
Gas |
Retail |
958 |
|
Gas |
Network |
78 |
|
Gas |
Not allocated |
32 |
|
Gas total |
1,068 |
|
|
Water |
Retail |
148 |
|
Water |
Network |
91 |
|
Water |
Not allocated |
54 |
|
Water total |
293 |
|
|
Non energy / non water total |
22 |
|
|
Centralised services total |
22 |
|
Complaint issues
Disputed high bills are the most common complaint issue received by EWON and these complaints increased 19.7% this quarter compared with the April to June 2026 quarter. Most other complaint issues within the top 10 are associated with energy bills, such as estimation, account management, tariffs (pricing) and delays.
There was a noticeable increase in complaints about tariffs and conditional discount or benefits. We expected to receive energy marketing-related complaints in the July to September quarter when retailers introduce new energy plans. Some of these complaints related to the new Solar Sharer Offer introduced as part of the DMO for FY27, and some related to the application of sign-up credits offered with new energy plans.
Top 10 core issues closed including the previous four quarters
Jul to Sep 2025 – Jul to Sep 2026
|
Primary issues |
Secondary > tertiary issues |
Jul 26 – Sep 26 |
Apr 26 – Jun 26 |
Jan 26 – Mar 26 |
Oct 25 – Dec 25 |
Jul 25 – Sep 25 |
|---|---|---|---|---|---|---|
|
Billing |
high > disputed |
2,368 30.91% |
1,979 30.26% |
2,096 33.15% |
2,372 36.49% |
2,707 37.67% |
|
Billing |
estimation > meter access / not read |
309 4.03% |
285 4.36% |
204 3.23% |
207 3.18% |
202 2.81% |
|
Billing |
error > payment |
196 2.56% |
202 3.09% |
188 2.97% |
194 2.98% |
222 3.09% |
|
Billing |
tariff > rate |
195 2.55% |
142 2.17% |
125 1.98% |
113 1.74% |
102 1.42% |
|
Billing |
account closing > error |
194 2.53% |
199 3.04% |
208 3.29% |
160 2.46% |
168 2.34% |
|
Billing |
account opening > error |
157 2.05% |
135 2.06% |
139 2.20% |
139 2.14% |
91 1.27% |
|
General |
energy / water |
156 2.04% |
206 3.15% |
152 2.40% |
143 2.20% |
152 2.11% |
|
Billing |
contract terms > conditional discount or benefit |
155 2.02% |
68 1.04% |
62 0.98% |
40 0.62% |
30 0.42% |
|
Billing |
delay |
153 2.00% |
151 2.31% |
179 2.83% |
112 1.72% |
101 1.41% |
|
Credit |
payment difficulties > current / arrears |
137 1.79% |
147 2.25% |
102 1.61% |
107 1.65% |
180 2.50% |
Water complaints
Water complaints increased compared to last quarter, with 293 complaints received. Water complaints represented 3.95% of EWON’s overall complaints this quarter, which is a typical proportion. It is important to note that most of our water provider members provide both retailers and network services. This quarter we received:
-
91 complaints about the retail services provided by water providers – 2.2% of all retail complaints)
-
148 complaints about network services provided by water providers – 22.9% of all network complaints).
Top five water core issues closed
July to September 2026
|
Issue |
Number |
|---|---|
|
Billing > high > disputed |
93 |
|
General > energy / water |
52 |
|
Land > property damage / restoration |
29 |
|
Supply > sewer overflow / blockage |
27 |
|
Customer service > failure to consult / inform |
22 |
Embedded network complaints
EWON received 195 embedded network complaints this quarter – a slight increase compared to last quarter.
Embedded network complaints by service providers
July to September 2026
|
Service provider |
Number |
|---|---|
|
Retail |
129 |
|
Exempt retailer |
47 |
|
Network |
6 |
|
Centralised services |
12 |
|
Not allocated |
1 |
|
Total |
195 |
Top five embedded network core issues closed
July to September 2026
|
Issue |
Number |
|---|---|
|
Billing > high > disputed |
43 |
|
Billing > contract terms > price increases |
26 |
|
Billing > affordability > price increases |
23 |
|
Billing > tariff > rate |
14 |
|
Billing > error > cross-metering |
8 |
Consumer energy resources complaints
EWON electricity complaints where the customer tells us they are using consumer energy resources (CER) increased to 1,012 complaints from 910 complaints last quarter.
Complaints received involving consumer energy resources by service provider
July to September 2026
|
Service provider |
Number |
|---|---|
|
Retail |
921 |
|
Exempt retailer |
12 |
|
Network |
22 |
|
Not allocated |
57 |
|
Total |
1,012 |
Top five core issues for closed complaints involving consumer energy resources
July to September 2026
|
Issue |
Total |
|---|---|
|
Billing > high > disputed |
360 |
|
Billing > tariff > feed-in |
46 |
|
Billing > tariff > rate |
39 |
|
Consumer energy resource > system performance > fault |
36 |
|
Billing > tariff > information |
31 |